Commodities Weekly: Corn prices surge to 3-year high

Most agricultural commodities have risen today following yesterday’s US Memorial Day holiday. Precious metals are drifting while base metals are feeling pressure from the worsening trade talks. Energy commodities have suffered from supply overhangs.
Agriculturals
CORN prices climbed to the highest since June 2016 today amid reports that US producers are delaying corn planting following a record wet spell across the country, with more rainy weather forecast to come. Today’s advance marks the 10th daily gain in the past 11 days as the commodity powers upwards from the near eight-month lows hit on May 13. The gains have reached more than 20% from the base.
The sudden U-turn in sentiment has seen speculative accounts turn net long for the first time since the week of February 26, according to the latest data snapshot from CFTC as at May 21.
Corn Weekly Chart
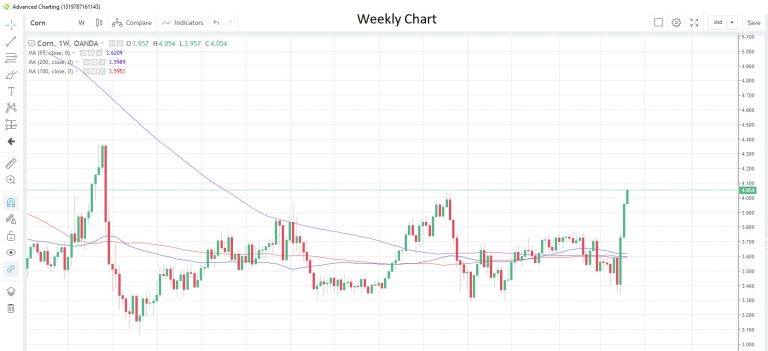
Source: OANDA fxTrade
SUGAR is still struggling to rebound from seven month lows hit earlier this month. Speculative investors are also not convinced that a rally is about to begin, as negative bets on the commodity increased to the highest since September last year, the latest data from CFTC shows.
Modi’s victory in the Indian general election is seen benefiting the sugar industry there, with more government subsidies expected, and this could lead to increased production and subsequently exports.
SOYBEAN prices have posted the biggest one-day gain in two weeks today and could aim for the highest level this month. Such a move could bring about the first up-month for the commodity in four months. Last week the US Department of Agriculture announced another aid package for American farmers that had been hurt by the US-China tariff war, notably corn, wheat and soybean farmers.
Speculative investors pared back negative bets on the commodity from the highest in more than 20 years in the week to May 21, according to CFTC data.
WHEAT prices have climbed to the highest levels since February 19 this morning, trading above the 200-day moving average at 4.855 for the first time since February 15. The boost comes amid supply-side concerns with reports circulating that the China harvests may be affected by heavy rainfall along the Yangtze and Han rivers.
The commodity is poised for the biggest monthly gain in two years, and this has pressured speculative investors to trim net short positions for a third consecutive week. They now stand at the lowest since the week of February 12, according to the latest data from CFTC as at May 21.
Wheat Daily Chart
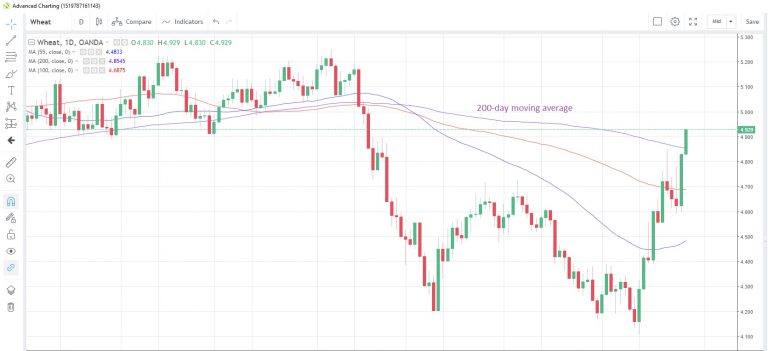
Source: OANDA fxTrade
Precious metals
GOLD could snap a three-month losing streak this month if it can at least cling on to gains made late last week. The deterioration in sentiment surrounding the US-China trade negotiations has given gold a lift as a safe haven asset.
Speculative investors trimmed net long positions for the first time in four weeks, the latest CFTC data shows, despite concerns about the global growth trajectory. News of an earthquake in Northern Peru close to a number of gold and copper mines had little impact.
SILVER continues to play the poor cousin to gold, barely able to get a lift from gold’s rebound and the US dollar’s slide. Silver is flat on the week, but the gold/silver (Mint) ratio is set for a fourth monthly gain after touching the highest in more than a decade earlier in the month. Speculative investors remain bearish on the commodity, and they increased their net short positions for the third week in a row, CFTC data shows. Short bets are now at the highest since November last year.
PLATINUM looks set for the third straight daily gain today but is still facing the biggest monthly drop since September 2017. Gloomy car sales globally continue to raise concerns about future demand for platinum. Speculative investors continue to bail out of stale long positions what had chased the commodity to one-year highs last month. Net long positions are now at the lowest since the week of February 19.
PALLADIUM looks poised for a second monthly drop in three months as it extends the recent decline from record highs above 1,600 in March. Yesterday, the 55-day moving average at 1,410.80 traded below the 100-day moving average at 1,412.43 for the first time since October 5. This is generally viewed as a medium-term bearish signal. Speculative investors might like to disagree however, as they increased their net long positions for the first time in three weeks, according to the latest report as at May 21 from CFTC.
Palladium Daily Chart
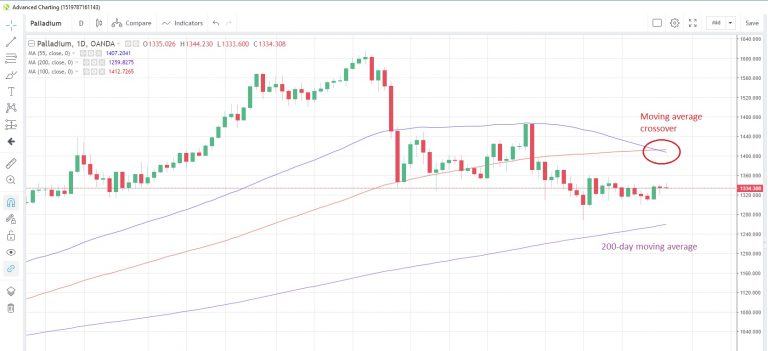
Source: OANDA fxTrade
Base metals
COPPER was under pressure in the latter part of last week as trade negotiations between the US and China deteriorated. The industrial metal is attempting a rebound this week, even though President Trump said yesterday he was not yet ready to do a deal with China. If the metal can maintain this week’s upward momentum, it would be the first weekly gain in seven weeks.
On the mining front, companies reported no noticeable damage to mines from the Peru earthquake, while wage negotiations at mines in Chile are entering possibly the final stages. The latest offer has been presented to the unions, which would be valid for 27 months. A first offer was rejected and the latest one has a deadline of this Friday.
Energy
CRUDE OIL prices suffered the biggest weekly decline this year last week as oil stockpiles continued to rise, which implies a slackening of demand. Bloomberg reported that a number of agencies, including the Energy Information Agency, have cut their oil demand forecasts by 9%-13% in the past 12 months. The report highlights that OPEC’s own forecast is the most conservative at 1.2 million barrels per day.
This could imply that the current production cuts may be with us for a while. Also on the supply side, the number of US oil rigs in production fell below the 800 mark for the first time since March 2018, weekly data from Baker Hughes has shown.
WTI has managed to hold above the 100-day moving average, now at $58.27, on a closing basis since February 26. It is trading at $58.97 today.
NATURAL GAS is still capped by the 55-day moving average. Two attempts to breach last week were beaten back and the average has capped prices on a closing basis since December 18. The market still has a supply overhang, with stockpiles increasing for the past eight weeks, according to EIA data.
Author

Andrew Robinson
MarketPulse
A seasoned professional with more than 30 years’ experience in foreign exchange, interest rates and commodities, Andrew Robinson is a senior market analyst with OANDA, responsible for providing timely and relevant market commentar


