China's Yield Curve Inverts: Will the US Follow?
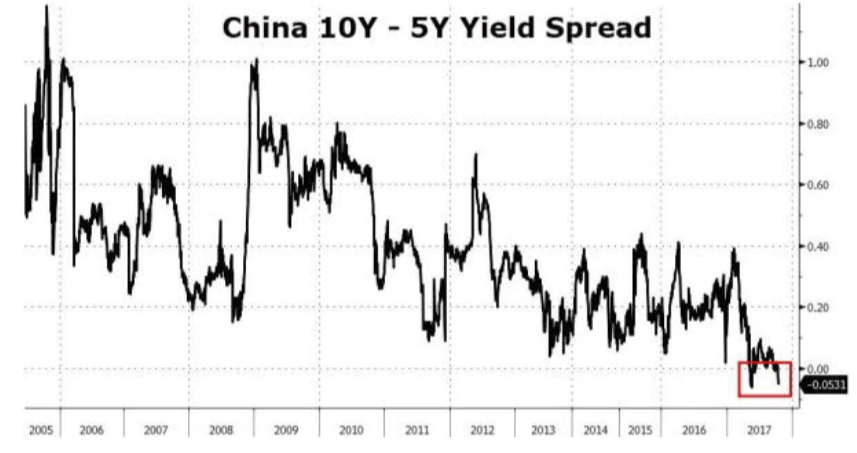
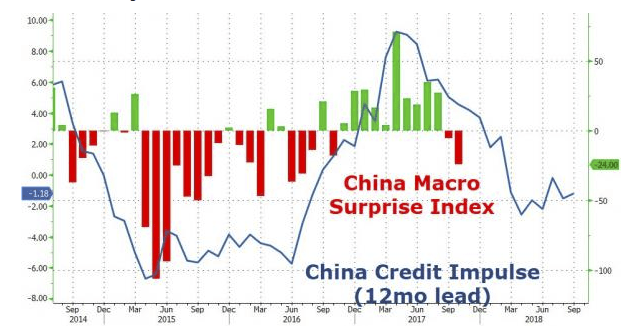
China's macro picture tumbled to its weakest since August 2016. Portions of the yuan yield curve inverted again as China attempts to rein in property bubbles and state-owned enterprise (SOE) excesses. The US yield curve hasn't inverted yet. What's in the cards?
The feature chart is from the ZeroHedge article Yield Curve Inverts, Yuan Slides As China GDP Growth Slows.
Here are a couple more charts of interest.
China Macro Surprise Index
China GDP
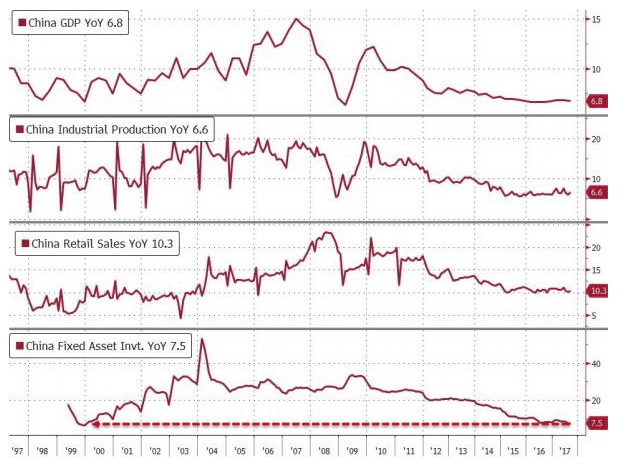
Most countries would be thrilled with 6.8% GDP, but not China. However, many analysts don't believe those numbers and I sure don't either.
I do not know what economists would count as a recession in China, but three or even four percent growth would be a disaster vs what China expects.
If China's GDP does drop to three percent growth, it's probably below zero with real world accounting.
China aside, let's put a spotlight on potential yield curve inversion in the US.
Massive Flattening of the US Treasury Yield Curve
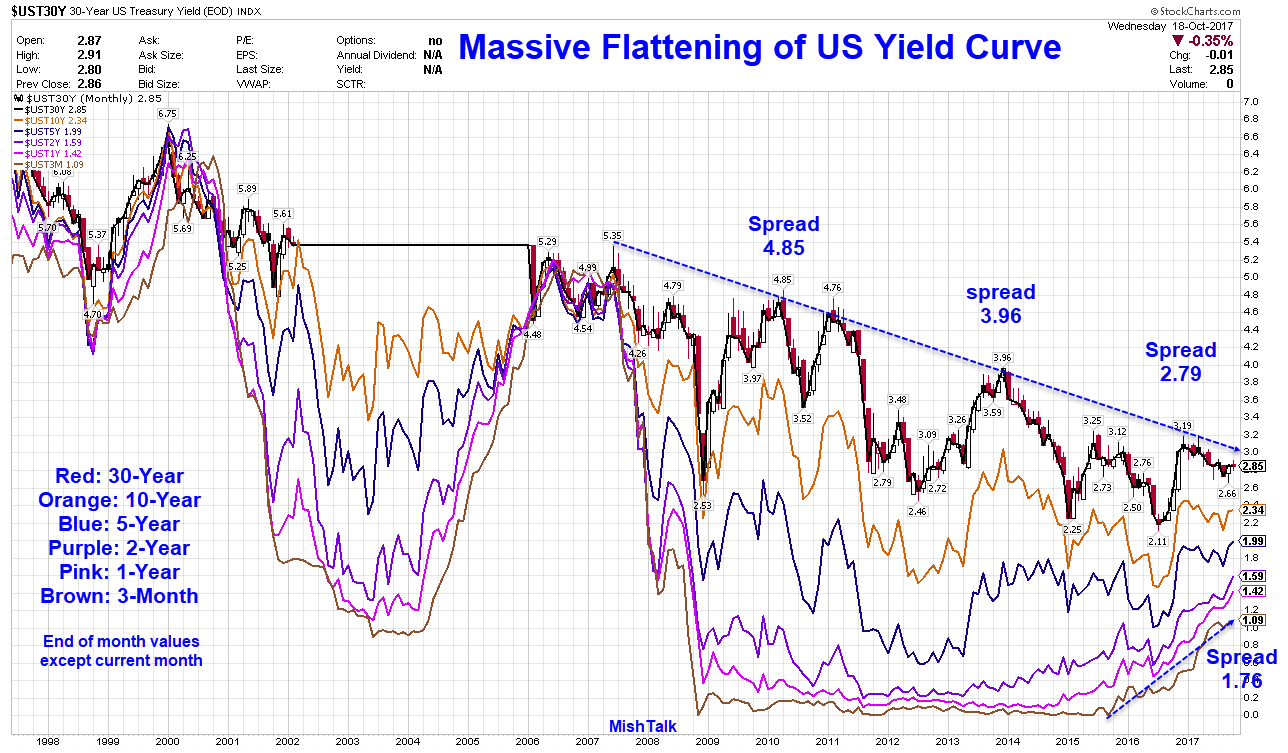
Inversion Synopsis
At no point is the curve inverted, but it would not take much for that to happen.
Potential Inversion Points
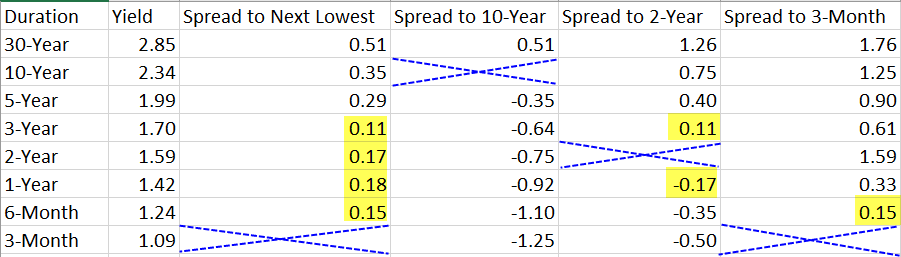
The yield curve is inverted any time a longer-duration security trades at a lower yield than a shorter-duration security. On the chart, everything above the blue x's is positive and everything below is negative. Nothing is inverted.
The Fed is a near lock to hike 25 basis points in December. I did not think we would get to this point but talk of a new tougher Fed chair to replace Janet Yellen in February has the market convinced.
Yet, the yellow highlights show a mere 11 to 18 basis points separates four points on the curve (the three on the right are duplicates).
If the Fed hikes 25 basis points and enough of that hike does not filter up, the yield curve will invert.
If inversion at any point sticks, a recession is likely at hand if not already in the rear view mirror.
Author

Mike “Mish” Shedlock's
Sitka Pacific Capital Management,Llc


