|

Bovespa Index long term cycles and bullish trend

The Bovespa Index has been trending higher with other world indices. Since inception the cycles have shown a bullish trend. In early years not seen on this chart it rallied with other world indices trending higher into the May 2008 highs. It then corrected the whole bullish cycle from the beginning. That was while most other world indices were in a pullback lower. The index ended that larger degree correction in October 2008. At this point is where the index corrected the whole decades long bullish cycle. Thus the October 2008 lows is from where this bullish cycle and swing analysis will begin.

First from the October 2008 lows the index rose into the November 2010 highs in what appears as an Elliott Wave impulse. From there the index endured an almost 6 year long correction of that cycle into the January 2016 lows.

The analysis continues below the chart.

Chart

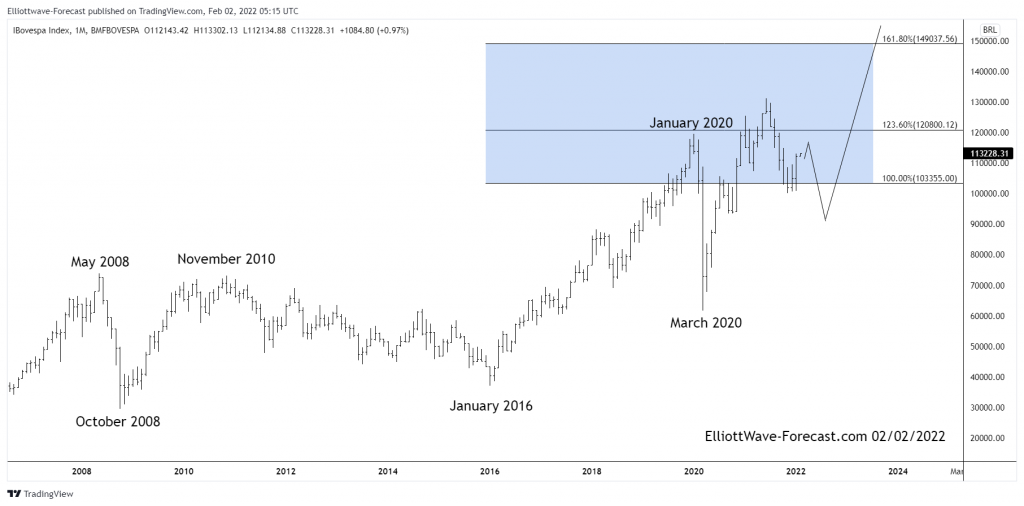
Secondly I want mention the blue box area that was reached in the cycle up into the January 2020 highs. This is Fibonacci extension measured from zero up to the May 2008 highs then back down to the October 2008 lows. This is a typical place for the next cycle higher in any degree to reach as it did in January 2020.

Thirdly and in conclusion. The pullback into the March 2020 lows was enough to suggest it was correcting the cycle from the 2008 lows. This was shared by other world indices and many others have already made new yearly highs in their bullish cycles. This emerging market index was no different and eventually did get back above the January 2020 highs. From the March 2020 lows the index appears to be an impulse when looked at in the lower time frames. There should be a bright future bullish outcome in the index while a pullback remains above the March 2020 lows.

Author

Elliott Wave Forecast Team

Elliott Wave Forecast Team

ElliottWave-Forecast.com

More from Elliott Wave Forecast Team
Share:

Editor's Picks

EUR/USD faces next resistance near 1.1930

EUR/USD has surrendered its earlier intraday advance on Thursday and is now hovering uncomfortably around the 1.1860 region amid modest gains in the US Dolla. Moving forward, markets are exoected to closely follow Friday’s release of US CPI data.
 

GBP/USD inching closer to 1.36

The Pound Sterling edged higher to 1.3640 on Thursday, recovering from an earlier pullback after stronger-than-expected US jobs data initially weighed on the pair. The Bank of England held rates at 3.75% at its February 4 meeting in a narrow 5-4 vote split, with four members preferring a 25 basis point cut to 3.50%. 

Gold falls to near $4,900 as selling pressure intensifies

Gold price faces some selling pressure around $4,910 during the early Asian session on Friday. The yellow metal tumbles over 3.50% on the day, with algorithmic traders appearing to amplify the precious metal’s sudden drop. Traders will closely monitor the release of the US Consumer Price Index inflation report for January, which will be released later on Friday. 

Ethereum investors face huge unrealized losses following price slump

US spot Ethereum exchange-traded funds flipped negative again on Wednesday after recording net outflows of $129.1 million, reversing mild inflows seen at the beginning of the week, per SoSoValue data. Fidelity's FETH was responsible for more than half of withdrawals, posting outflows of $67 million.

A tale of two labour markets: Headline strength masks underlying weakness

Undoubtedly, yesterday’s delayed US January jobs report delivered a strong headline – one that surpassed most estimates. However, optimism quickly faded amid sobering benchmark revisions.

Aster Price Forecast: Demand sparks on Binance Wallet partnership for on-chain perpetuals

Aster is up roughly 9% so far on Thursday, hinting at the breakout of a crucial resistance level. Aster partners up with Binance wallet for the second season of the on-chain perpetuals challenge.