Bitcoin Drops Significantly

Bitcoin is now present in mainstream media. On the Bloomberg Markets website, we read:
Bitcoin fell for a fifth day, the longest losing streak in more than a year, after one of China’s largest online exchanges said it would stop handling trades by the end of the month amid a government crackdown on cryptocurrencies.
BTC China will immediately stop accepting new account registrations on its BTCChina Exchange, Chief Executive Bobby Lee said Thursday in a tweet. The decision was made after “carefully considering” the Sept. 4 announcement by Chinese regulators that outlawed initial coin offerings, he said.
(…)
China plans to ban trading of bitcoin and other virtual currencies on domestic exchanges, Bloomberg News reported Monday. The ban will only apply to trading of cryptocurrencies on exchanges, according to people familiar with the matter, who asked not to be named because the information is private. Authorities don’t have plans to stop over-the-counter transactions, the people said.
The fact that mainstream media outlets have picked up both on Bitcoin’s meteoric rise and on the recent news from China suggests that the interest in the currency might have peaked. At the same time, the actual news from China is relatively worrying for the short term. BTCChina is among the most prominent Bitcoin exchanges globally in terms of volume. Going further, China is one of the top three currencies exchanged for Bitcoin. This hints at the possibility that the Chinese ban might negatively affect the price. And so far it seems to have. Bitcoin declined to the tune of 30% from its recent all-time high. While this looks severe at first sight, we have to remember that this is Bitcoin we’re thinking about. In perspective, a 30% drop is nothing unheard of in the Bitcoin market. Also, China is now a lot less important for the Bitcoin market than it was, say, a year ago, accounting for roughly 10% of Bitcoin trading compared with 98% at one point in the past. So, the question now is whether this impact is lasting or will it be reversed.
For now, let’s focus on the charts.
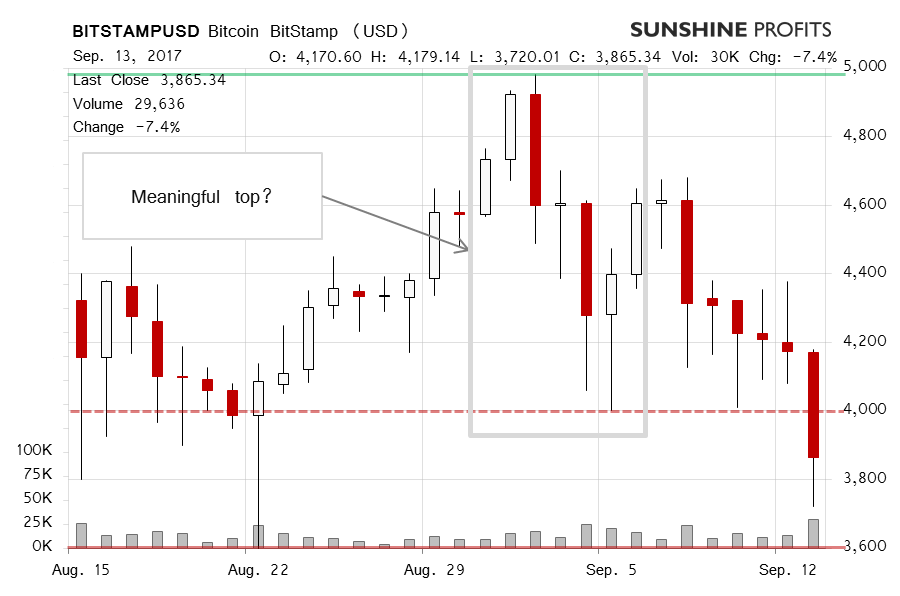
On BitStamp, we clearly see the slump from the all-time high. In our previous commentary, we wrote:
As it turned out, the lack of decisive movement to the downside was followed by appreciation. Bitcoin almost hit $5,000, it made yet another all-time high and we’ve seen mostly depreciation ever since. Is this enough to turn the market around?
And it transpired that in the short term the market did turn around. Quite interestingly, Bitcoin erased almost exactly 50% of the preceding rally before bouncing slightly to the upside from this level. This is similar to what we saw at the previous downturn. It might just be the case that the 50% level right now is the trigger that might be the beginning of the next big move to the downside. Alternatively, a lack of breakdown below this level might be read as a bullish signal.
In keeping with our previous comments, the situation is now decisively more bearish than it was at the moment our previous alert was posted. At the same time, we haven’t really seen a breakdown below the 50% retracement level and the move below the 38.2% retracement is not confirmed in terms of time. Additionally, from a very long-term perspective, Bitcoin has corrected more than 23.6% of the move from $162 to $4,970. While this might be a very bearish indication, we have to remember that we saw a similar move after the previous local top around $3,000. It was the 38.2% retracement that stopped the move then. If we don’t see a move below the 38.2% retracement ($3,133), we might not have enough bearish indications on our hands. This might change based on future market action.
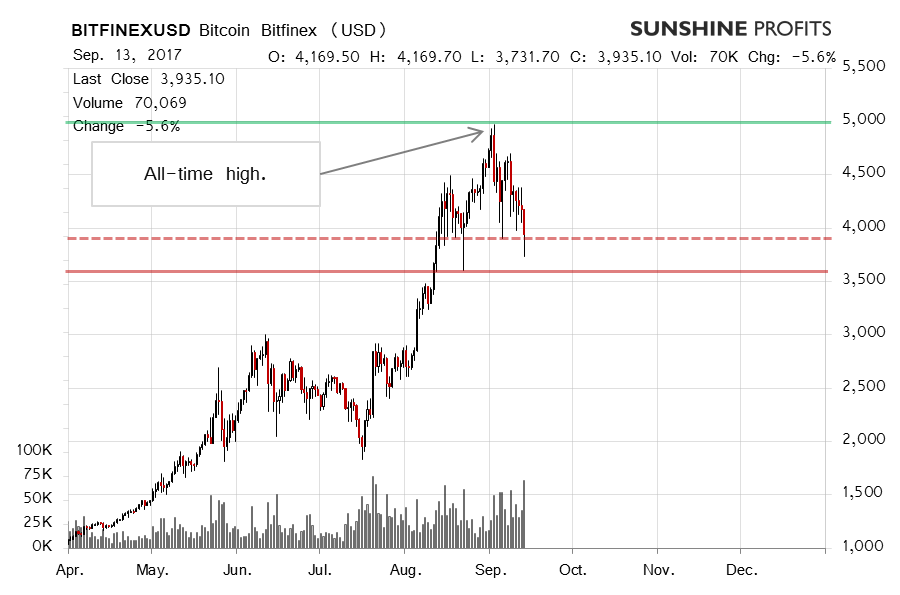
On the long-term Bitfinex chart, we again see the recent depreciation. Our previous alert:
(...) we see the very significant appreciation from around $2,000 to the mentioned level of $5,000. Right now, after a series of depreciation days, we see the currency around $4,200. Is the situation changed? We saw a move below the 23.6% Fibonacci retracement level at $4,228 which was then invalidated and right now we’re seeing Bitoin at this level but not really below it. The quick invalidation of the breakdown is actually a bullish hint. This is generally confirmed by the fact that the RSI didn’t really move to extreme levels during the recent upswing. Yes, it went overbought but it didn’t reach levels from the previous upswing, not to mention the 2013 top. And right now, the RSI is neutral. All this suggests that there might still be some room for a move to the upside.
On the other hand, Bitcoin is now relatively firmly present in mainstream media. The story about a possible Chinese ban has been transmitted by major media outlets and Bitcoin is hitting main pages of the market sections of media sites more frequently than it did in the past. This not yet the typical mania level but we’re definitely seeing signs of a top here in terms of the popularity of an investment. Will the China move prove to be the necessary catalyst for a move down? It might but we haven’t really seen enough action to confirm that. So far, if we don’t see Bitcoin move below the 38.2% retracement ($3,769), we are disinclined to consider hypothetical short positions. If anything of substance happens, we might change our opinion.
Want free follow-ups to the above article and details not available to 99%+ investors? Sign up to our free newsletter today!
Author

Mike McAra
Gold Price Forecast
Mike is a quantitative analyst focused on the economic reality, not theoretical models. His investment thinking is grounded on empirical evidence and common sense.















