Beware, gold bulls – That’s the beginning of the end

Strong words, I know. Can I back them up? Well, what we see now – looking at various markets – does indeed look like the start of gold’s end.
“Everything that has a beginning has an end.”
The oracle in matrix revolutions, 2003
The counter-trend rally has probably just ended, and the final big downswing has probably just started. This “beginning” of the final downswing is, in my opinion, the beginning of the final part of the prolonged sideways trend in gold that started in 2011. In the case of silver and mining stocks, that’s likely the final part of the decline that started back then.
These are strong words – I know. Let’s see if I can back them up.
First of all, I’ve been writing about the analogy between 2013 and now for many weeks now, and you can read about these analogies in this week’s flagship analysis. This key link remains intact. The charts given below confirm that from the short-term point of view.

In yesterday’s analysis, I commented on them in the following way:
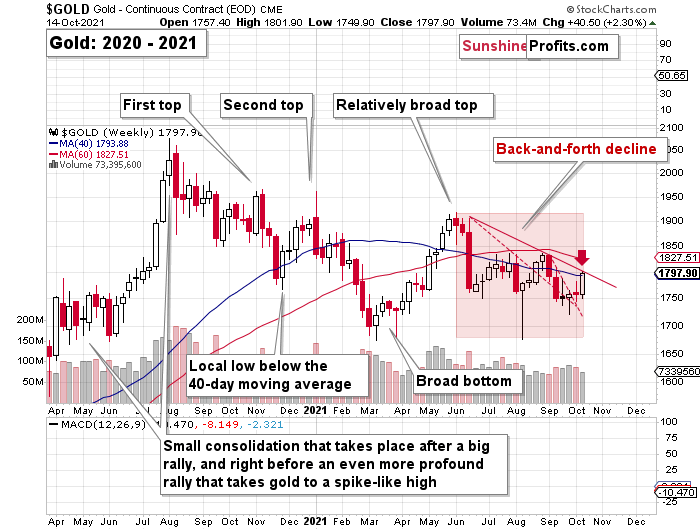
Gold jumped to its 40-week moving average and to the declining red line based on the previous short-term highs. Let’s check the context – what happened in 2013?
Right before moving to its previous medium-term lows, gold moved to its declining red resistance line that was also very close to its 40-week moving average. I marked this situation with a red arrow on both charts.
As you can see, nothing changed. The link between 2013 and now remains completely intact and its implications remain very bearish.
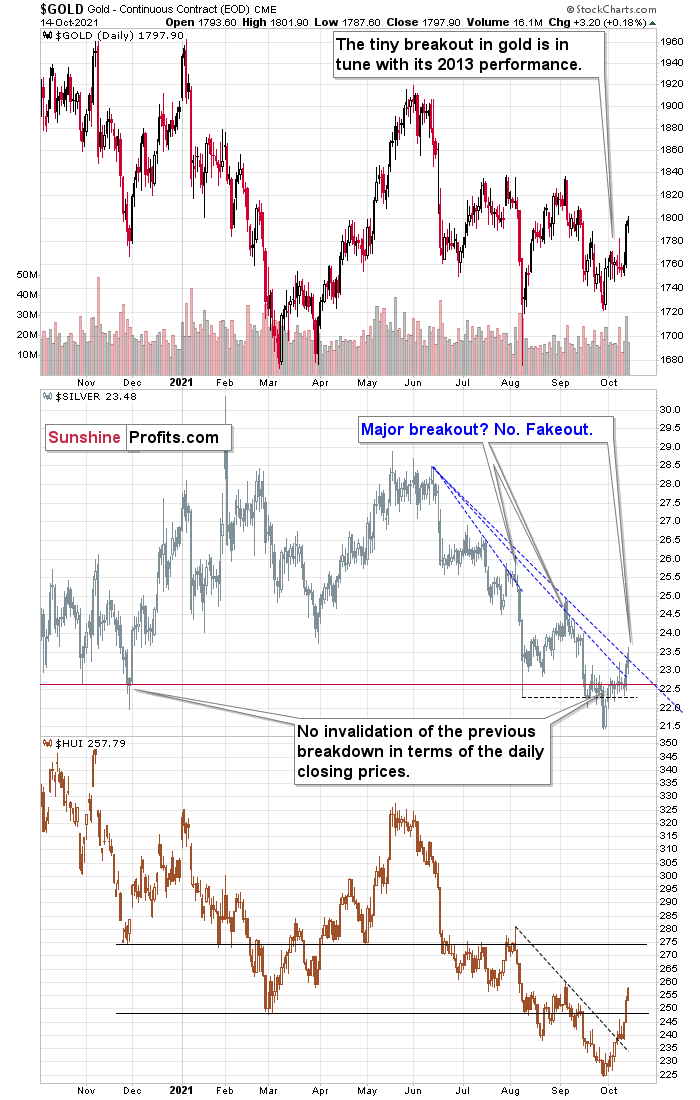
On a very short-term basis (yesterday’s session), silver outperformed gold and moved above its declining resistance line.
While gold moved higher by 0.18%, silver moved higher by 1.32%. I wrote this numerous times, and I’m going to write about this again today – silver’s very short-term outperformance of gold is not a bullish sign but a bearish one, and being aware of that is one of the more useful gold trading tips.
As far as silver’s “breakout” is concerned, it’s nothing bullish either. When you look at the August top, you’ll see that it also happened after a small, short-term breakout. The same with the early-September high. We’re seeing the same thing once again, and the implications are, once again, bearish.
On the bottom part of the above chart, you can see the HUI Index – a proxy for gold stocks. It moved notably higher recently, and it even moved above its March low, but it’s still far from its November 2020 low. So, taking a broader point of view, gold stocks are still the weakest part of the precious metals sector right now.
Moreover, please note that gold failed to hold its tiny move back above $1,800 – it was quickly invalidated. At the moment of writing these words, gold is trading at about $1,785.
Also, speaking of mining stocks, let’s take a look at what the juniors did.
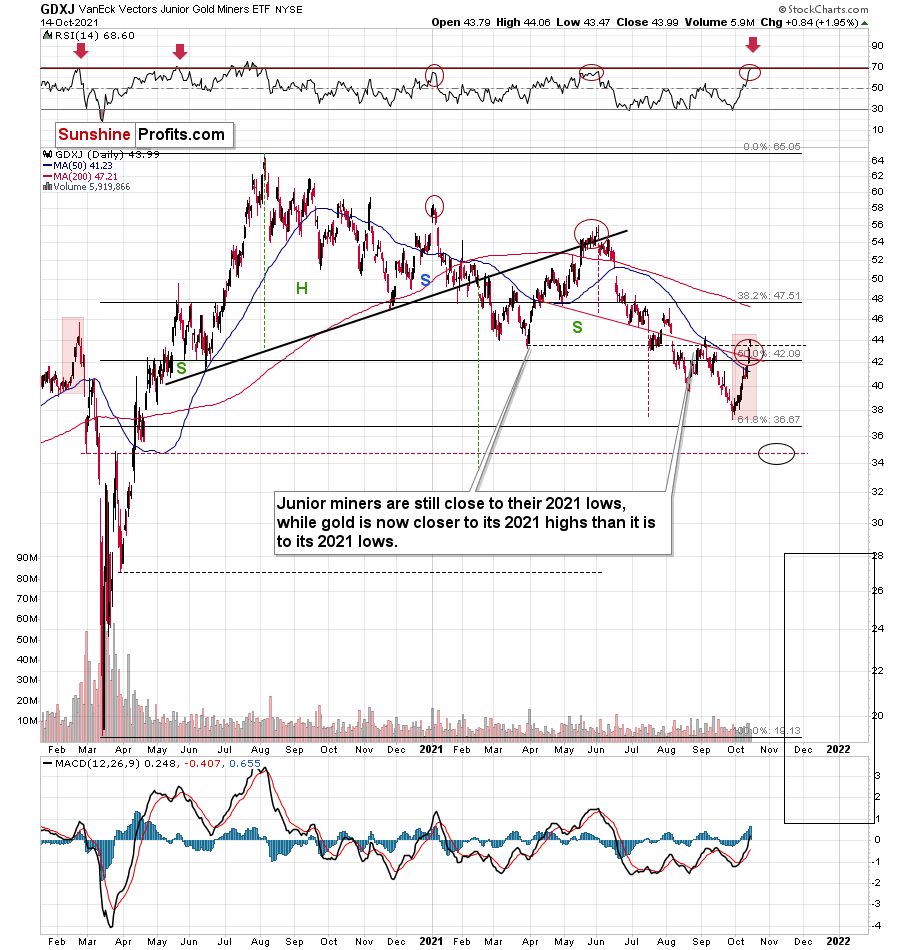
They rallied profoundly, which by itself might not be the most exciting thing you read today, especially given our short positions in them (let’s keep in mind that we took profits from the previous short position in the junior miners on Sep. 28, just one day before the bottom), but it is quite interesting when you consider how high the RSI is right now, and when in the past both the RSI and the GDXJ itself were trading at today’s levels.
That was in late February 2020. Back then, juniors were after a short-term rally from below $40, and they topped above $44. The RSI approached 70 – just like what we see today. And then the GDXJ declined below $20 in less than a month. I think the decline will take place longer this time, but the outlook is still extremely bearish.
By the way, the last time when the RSI was as high as it is right now was… right at the 2020 top. That’s yet another indication for gold that signals that the top is in or at hand.
But why shouldn’t gold, silver, and mining stocks rally even higher before turning south? Not only are they overbought on their own, but they actually have a good reason to reverse, which is coming from the USD Index.
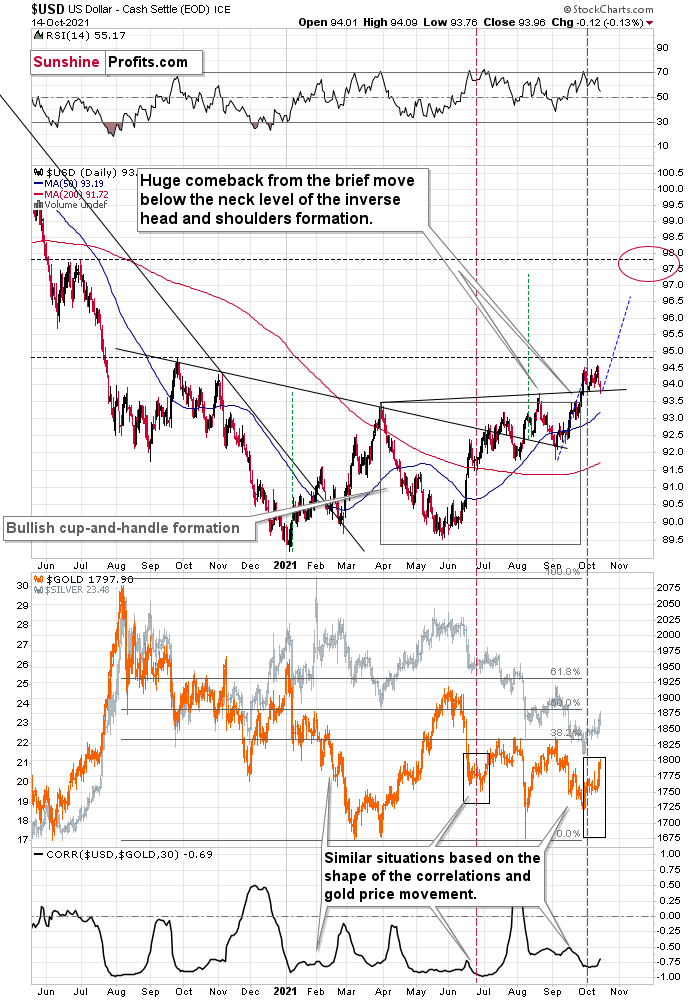
The USD Index moved back to its previous 2021 lows and its rising support line, and then it moved back up. It’s also been moving higher in today’s pre-market trading.
This tells us that the corrective flag pattern might already be over and – since the support held – the next move higher is quite likely just about to start, or it’s already underway.
Even though the USD’s move higher is so far very tiny, gold and silver are down by about 0.5% today. Is the top in the PMs in? This seems quite likely to me. What we see right now – especially in light of the analogy to Feb. 2020 in the GDXJ – does indeed look like the beginning of the end.
Want free follow-ups to the above article and details not available to 99%+ investors? Sign up to our free newsletter today!
Want free follow-ups to the above article and details not available to 99%+ investors? Sign up to our free newsletter today!
Author

Przemyslaw Radomski, CFA
Sunshine Profits
Przemyslaw Radomski, CFA (PR) is a precious metals investor and analyst who takes advantage of the emotionality on the markets, and invites you to do the same. His company, Sunshine Profits, publishes analytical software that any


