A new high in the US dollar? Rationales are stacking up

Commentary & Analysis
1. US Dollar Index Wave Chart: We have cautiously maintained our US dollar bias through the latest downtrend measured from the beginning of April this year labeled wave [b]. We have been suspecting/hoping (given our positioning) the dollar was correcting lower in what is a standard zig zag (A-B-C) correction lower completely Wave 4. But this move has been deep and many have jump aboard the top is in train of thought. As the dollar neared a key support level, which we have labeled a 50% retracement (98.40) of the last major Wave up—Wave 3—it did so with a slight divergence in momentum; i.e. lower prices but momentum oscillators turned higher. We think today's sharp rally in the dollar is the beginning of Wave 5 higher, which should carry to at least 106.

As much as we like our own charting, it was the following rationales that played a key supporting role keeping us dollar bullish...
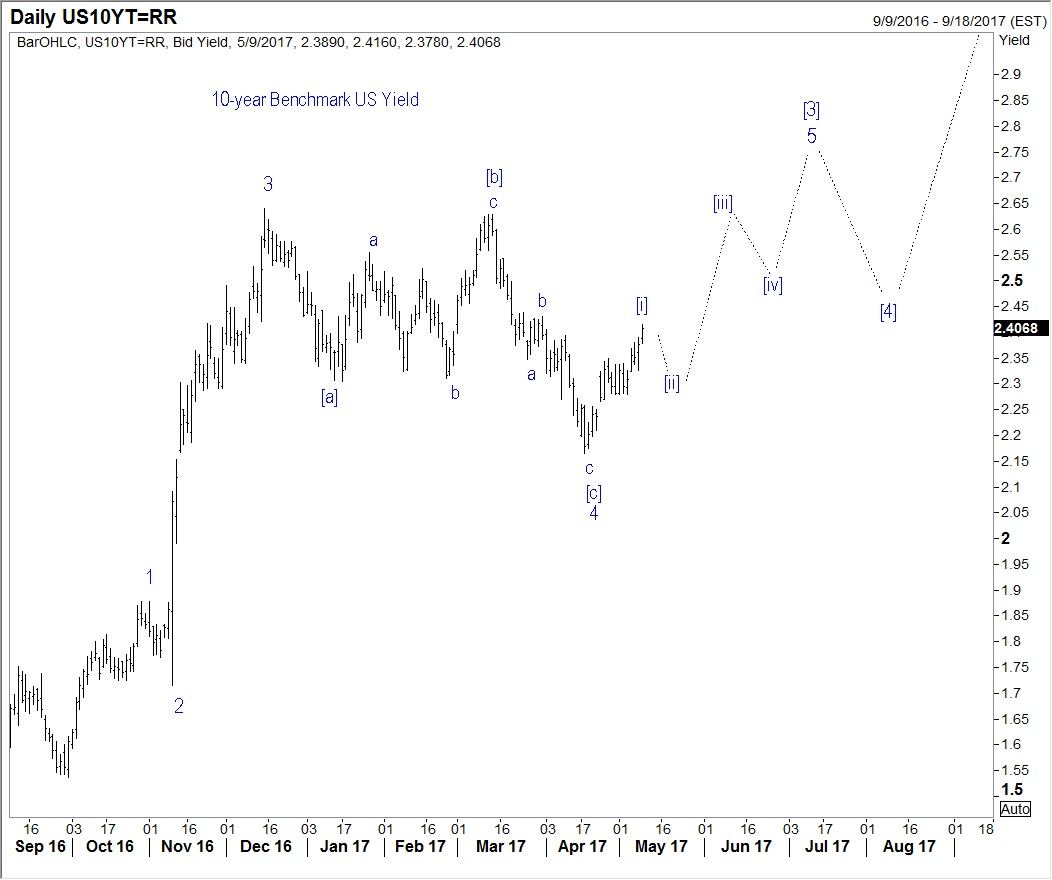
2. US 10-year benchmark yield: Despite the belief voiced by many commentators the Trump reflation trade was, or is, over, we maintained confidence in our Wave view for long yields, as seen below. At least a modicum of confidence here is critical to maintaining a dollar bullish view. That's because over time interest rates, or more importantly, relative yield spread (e.g. United States yield versus Eurozone yield) is probably the most important indicator of the intermediateterm direction of currency value (the major exception to this rule is the Japanese yen). The problem with this rule, is the fact that no one can predict interest rates. But as said, we think the Wave view below makes sense still; and we have been working off this view for several months...
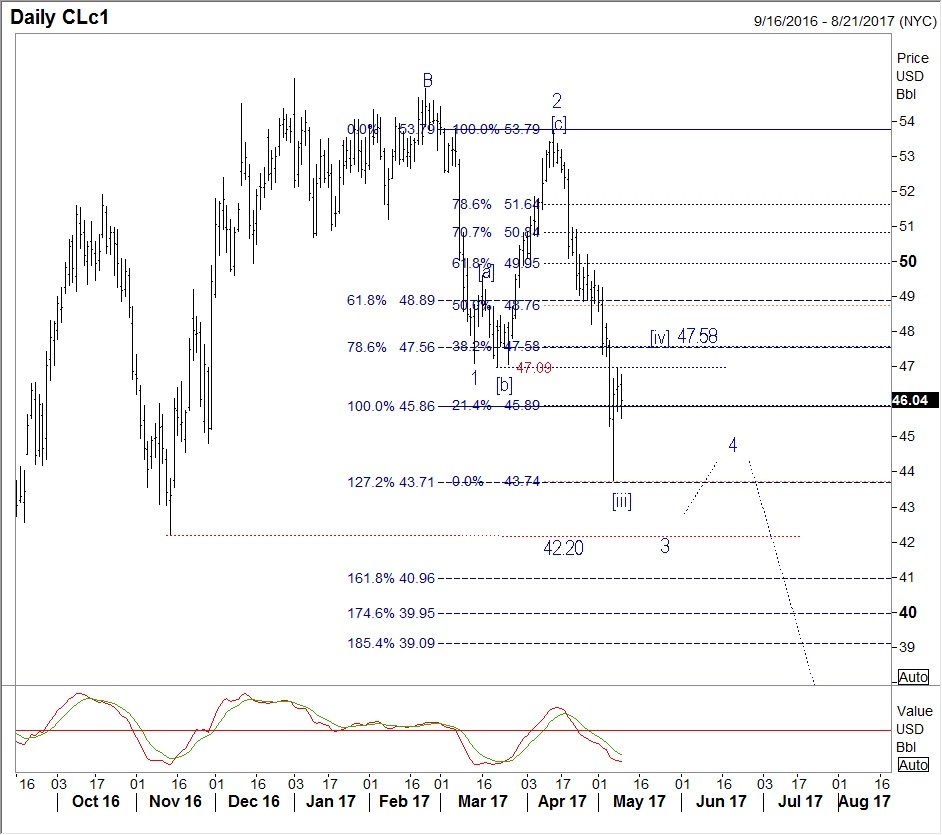
3. Oil: One of those trite little axioms of trading says: don't trade until you are confident in your trade. I have to admit, I am never "confident" about any trade, based on the standard definition of the word. The best I can muster is a modicum of confidence, and that standard is low. Given I am pictorially oriented, I prefer to talk in terms of "setup" that make sense, instead of confident. And among all of the key markets Black Swan follows, we liked the setup in oil prices best. Needless to say, oil and the dollar are notorious for maintaining a tight negative correlation; i.e. if oil is going down then the dollar is likely going up, and vice versa. Of course, there are periods where this tight negative correlation may not apply; however, these periods are usually shorter term in nature (and in fact the move down in oil during April has mirrored a move down in the US dollar, blowing that correlation thing). So, it was our oil view which was the heaviest weight in maintaining a longer-term dollar bias (we shared this view in a recent Currency Currents back on 18 April, when oil was 52.31 per barrel). Below is an update since then, and so far, so good— downtrend still intact though extended near term:
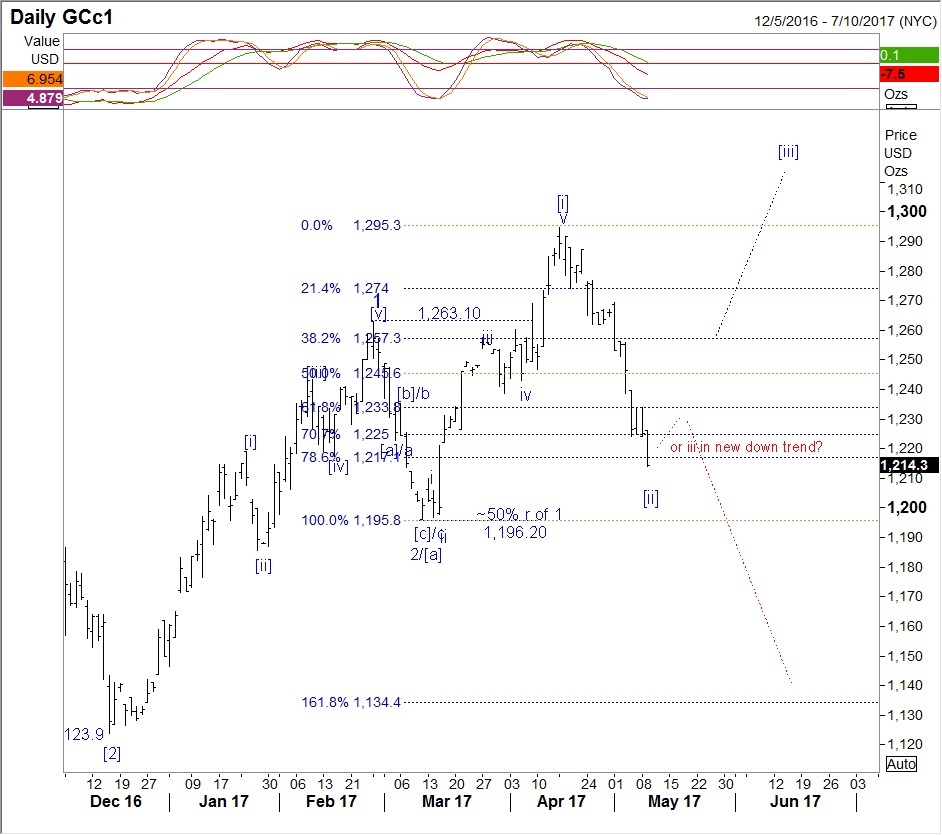
4. Gold: Last but not least, but possibly the most ephemeral of the bunch. Again, the longer-term correlation of gold and the dollar is pretty tight, as it is with oil. I've have talked about why this relationship makes economic sense. Gold is real money. Gold is priced in the world reserve currency—the US dollar (fiat money). Thus, when world reserve currency (US$) declines in value, gold priced in fiat has to cost more in fiat terms to maintain its real value against real goods. That being said, and why this correlation can be most ephemeral over the short- and intermediate-term time frames is the fact both the US dollar and gold can act as safe havens at the same time. We saw this during the credit crunch. We will likely see it again at some point in this cycle. Thus, the sharp decline in gold (though we were still expecting the move to be corrective) has supported out US dollar bullish bias, despite the fact the dollar has declined with gold of late. Net-net gold's price action has been dollar supportive, we think. And today's sharp decline in gold, mirroring the sharp rally in the dollar index, adds validity. As you view the gold chart below, remain open to the idea a whole new downtrend is underway if the US dollar bull trend is back in vogue and we don't see a major risk-off dislocation in global equities.
We cover all of the markets discussed above in our Key Market Strategies service. For the record, we suggested our subscribers there go long the US dollar index today, using either an exchange traded fund (UUP) or the futures market.
Author

Jack Crooks
Black Swan Capital
Experience Jack has over 30 years of experience in the currency, equity, and futures arena. He has held key positions in corporate financial analysis, brokerage, investment research, money management, and trading.


