22 Yield Curve Inversions: Recession at Hand, Buy Gold


Yields dropped across the board today as the Fed said it would be patient. A "Dot Plot" shows no hikes expected in 2019.
The lead chart shows interest levels today vs those on December 18, the last meeting in which the Fed hiked rates.
22 Inversions!
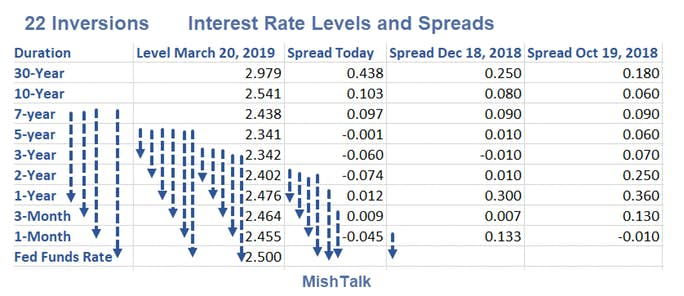
- 7-Year with FFR, 1-Month, 3-Month, 1-Year
- 5-Year with FFR, 1-Month, 3-Month, 1-Year, 2-Year, 3-Year
- 3-Year with FFR, 1-Month, 3-Month, 1-Year, 2-Year
- 2-Year with FFR, 1-Month, 3-Month, 1-Year
- 1-Year with FFR
- 3-Month with FFR
- 1-Month with FFR
A 10-year vs 3-month inversion is only 8 basis points away.
Deficit Warning Sign
Note the stubbornness of the 30-year yield. It's only down 9 basis points since December 18 whereas every duration between 2 years and 10 years inclusive is down a minimum of 25 basis points.
Three-year notes through 7-year notes are down 30 basis points since December 18.
Also, please note the spread between the 30-year long bond and the 10-year note was 18 basis points on October 18, 2018; 25 basis points on December 18, 2018; and 44 basis points on March 20, 2019.
I repeat my view that the long end of the bond market is very concerned about US government deficits exceeding $1 trillion dollars for the next five years minimum.
Recession Warning
The bond market today provides a clear recession signal. If you prefer, the Fed is strongly acting to prevent one.
However, this is out of the Fed's hands.
- The global economy is slowing rapidly.
- Europe is already in recession (that viewpoint just has not been officially recognized yet except for Italy). Brexit, no matter the outcome, has sealed the European fate.
- China and Japan are both cooling rapidly.
- The US will not be immune.
Do not discount the possibility that a US recession has started already.
Trade and Budget Deficit Concerns
- Trump's trade deficit reduction ideas via tariffs are "Mission Impossible": Tariffs Didn't Reduce the Trade Deficit (Deals Won't Either)
- As noted above, action in the long-bond suggests bond market deficit concerns. For discussion and projections, please see Projected US Budget Deficit Lie in Four Pictures.
- For a comparison of Fed rate hike projections today vs December 18, 2018 please see Fed Pledges "Patience", Dot Plot Suggests No Hikes in 2019
The most likely way the trade deficit shrinks is via recession. See the "Mission Impossible" case above for discussion.
Buy Gold
Meanwhile, buy gold. The budget deficit picture will get much worse in a recession.
Author

Mike “Mish” Shedlock's
Sitka Pacific Capital Management,Llc
Mike “Mish” Shedlock is a registered investment advisor for SitkaPacific Capital Management.


