WTI tumbles back into $72.00 as sentiment weighs, volatility declines
- Growing odds of a Gaza ceasefire has seen Crude Oil tumble.
- A surge in US NFP figures sent Crude Oil even lower on Friday.
- OPEC has a long road ahead of it to overcome non-OPEC production growth.

West Texas Intermediate (WTI) US Crude Oil fell into familiar lows on Friday, driven down by geopolitical fears washing out on hostage negotiations and sparks of doubt that OPEC will successfully under-produce pumping growth in the non-OPEC sphere.
Qatar is heading up efforts to negotiate a ceasefire in Gaza, if at least temporarily to allow the exchange of hostages, and Qatar’s steady success in talking down both sides of the conflict is seeing Crude oil flounder as geopolitical tensions ease.
The Organization of the Petroleum Exporting Countries (OPEC) is set to see a long-term challenge in 2024 and 2025 as OPEC tries desperately to undercut global non-OPEC production, imposing stiff production quotas on member nations as non-OPEC producers such as the US outstrip OPEC pumping caps. Analysts are increasingly concerned that the US and other non-OPEC producers could entirely oversupply global markets, and investors will be keeping a close eye on inventories in 2024.
US Nonfarm Payrolls: surge 353,000 in January
US Nonfarm Payrolls (NFP) surged to a twelve-month high of 353,000 in January, well over the market’s median forecast of 180K. With the US economy continuing to show stubborn resilience and the US labor market remaining at record highs, odds of a market-support rate cut from the US Federal Reserve (Fed) continue to decline.
WTI Crude Oil technical outlook
WTI has extended declines and fallen even further away from the 200-hour Simple Moving Average (SMA) at $76.00 per barrel, and US Crude Oil has shed nearly 10% from its last swing high into $79.19.
WTI has declined for a third straight day and closed in the red for four of the last five trading days, facing a daily candlestick rejection from the 200-day SMA near the $78.00 handle.
WTI hourly chart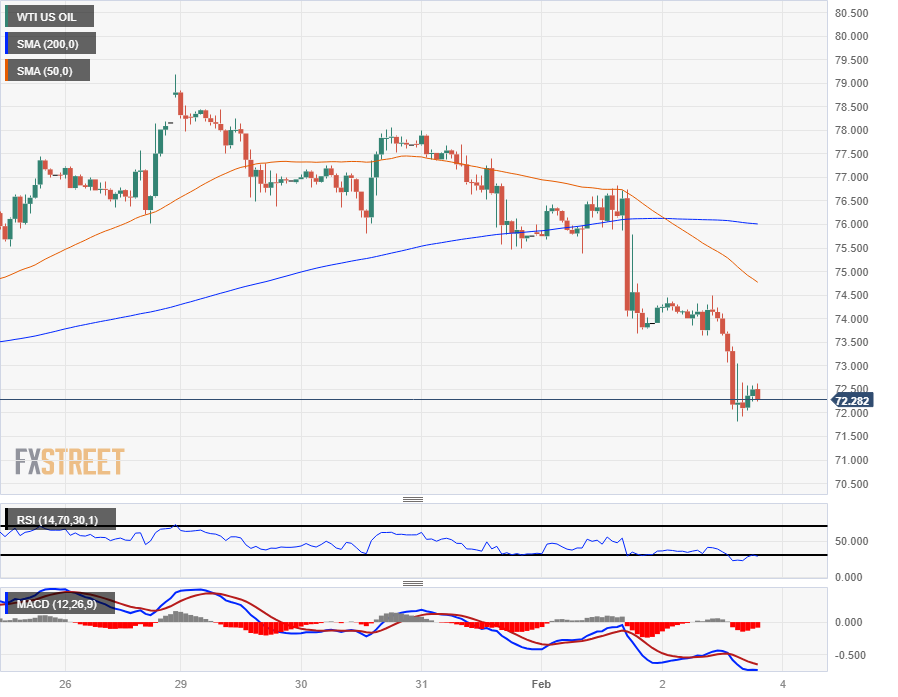
WTI daily chart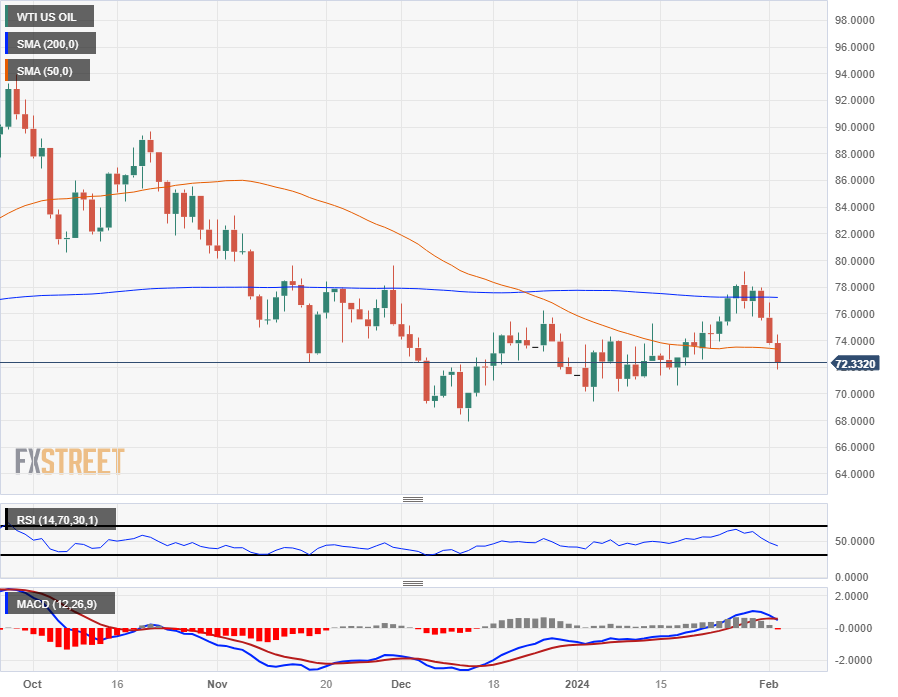
Author

Joshua Gibson
FXStreet
Joshua joins the FXStreet team as an Economics and Finance double major from Vancouver Island University with twelve years' experience as an independent trader focusing on technical analysis.


