|

WTI Technical Analysis: Quick drop for Friday sees WTI testing into $53.00

  • Crude oil prices took another step lower in early Friday trading, pinging into the 52.60 territory before settling back near 53.25.
  • WTI Chart, 5-Minute
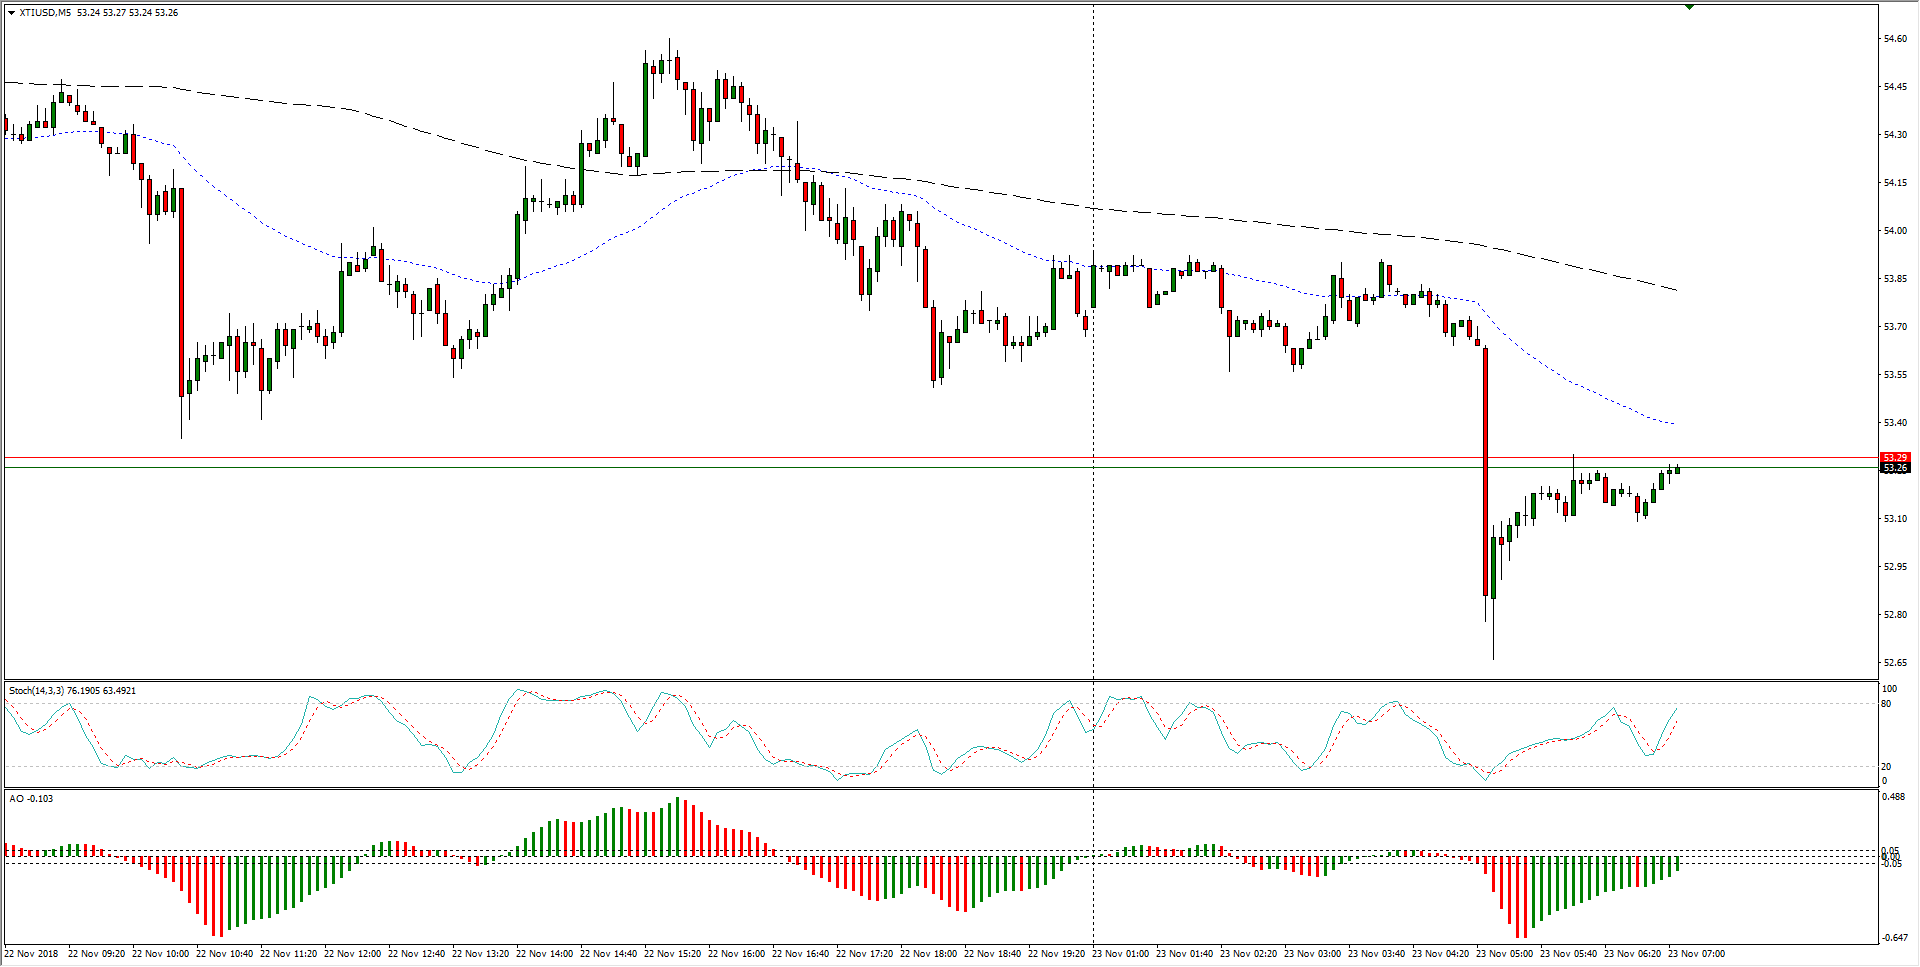
  • Despite Friday's early dip-and-rise, crude oil remains closely tied to recent action, with WTI currently chained to a range between the 38.2% Fibo retracement level at 54.36 and this week's new low at 52.59.

WTI Chart, 30-Minute

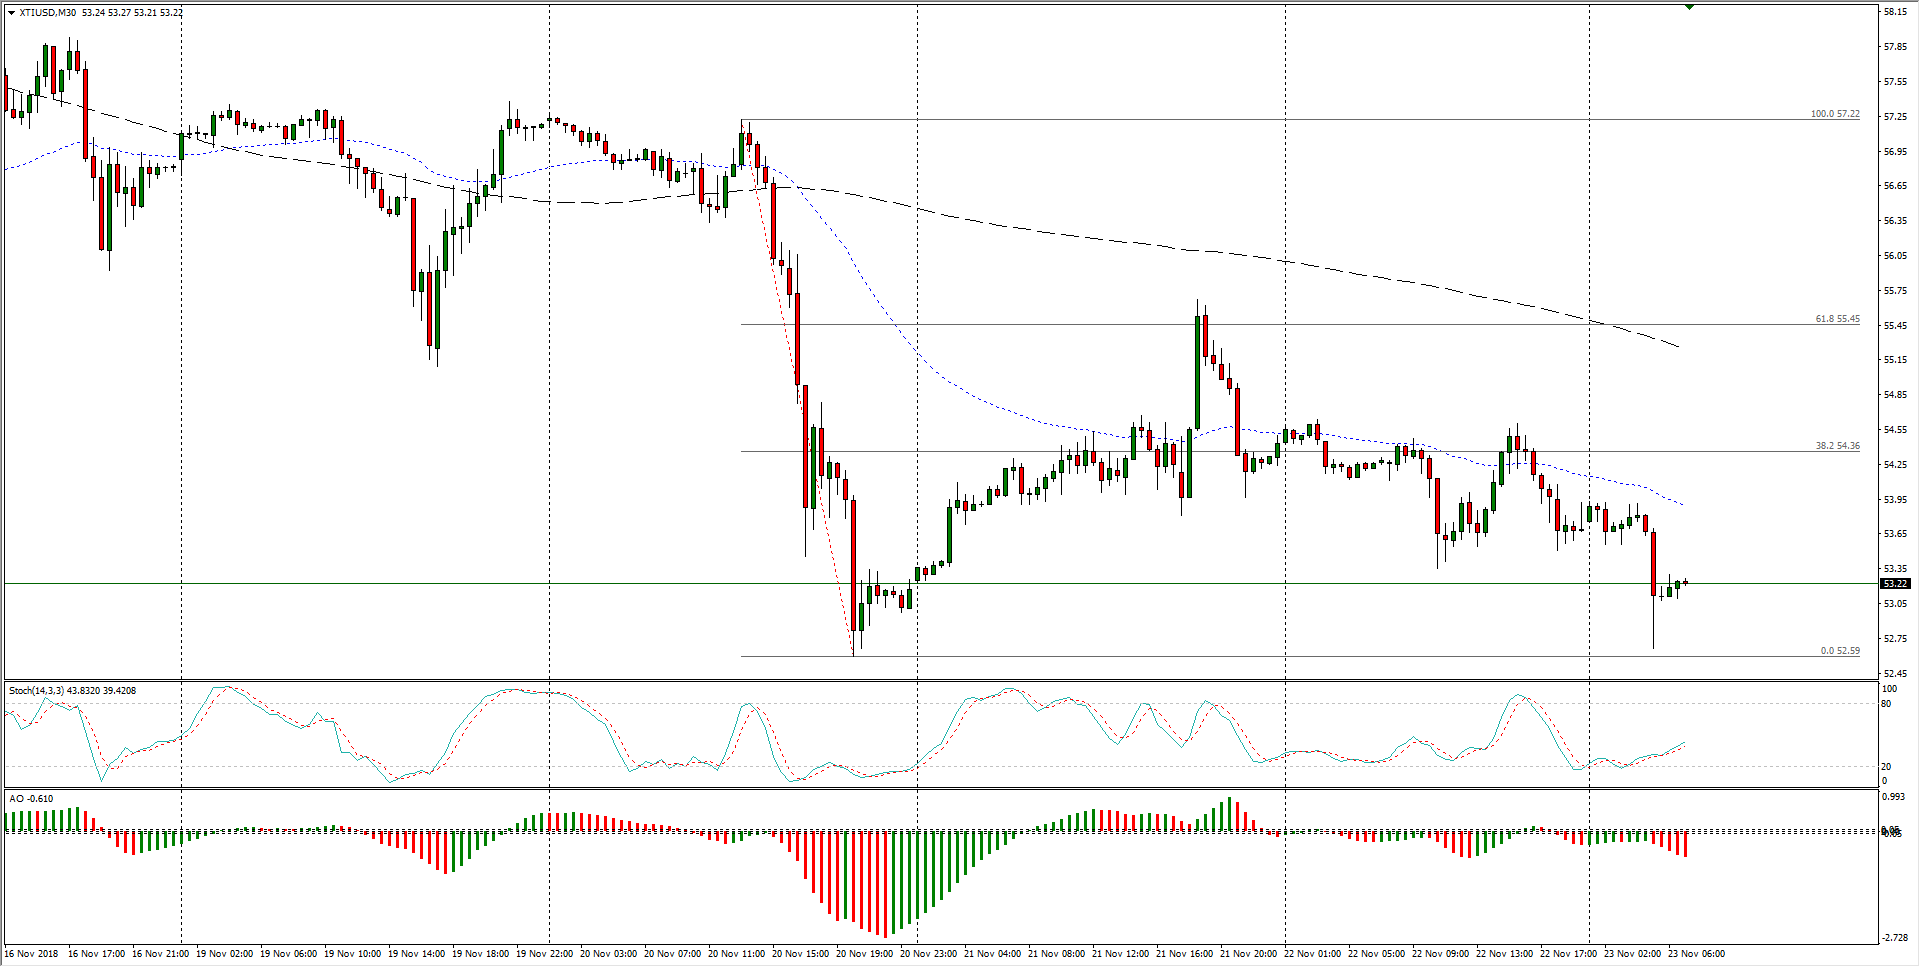
  • Moving to the medium-term, crude barrel costs remain trapped in a steady bearish trend, set to close bearish for a seventh week straight as lower highs continue to mark in declining resistance as the 200-period moving average struggles to catch up to price action.
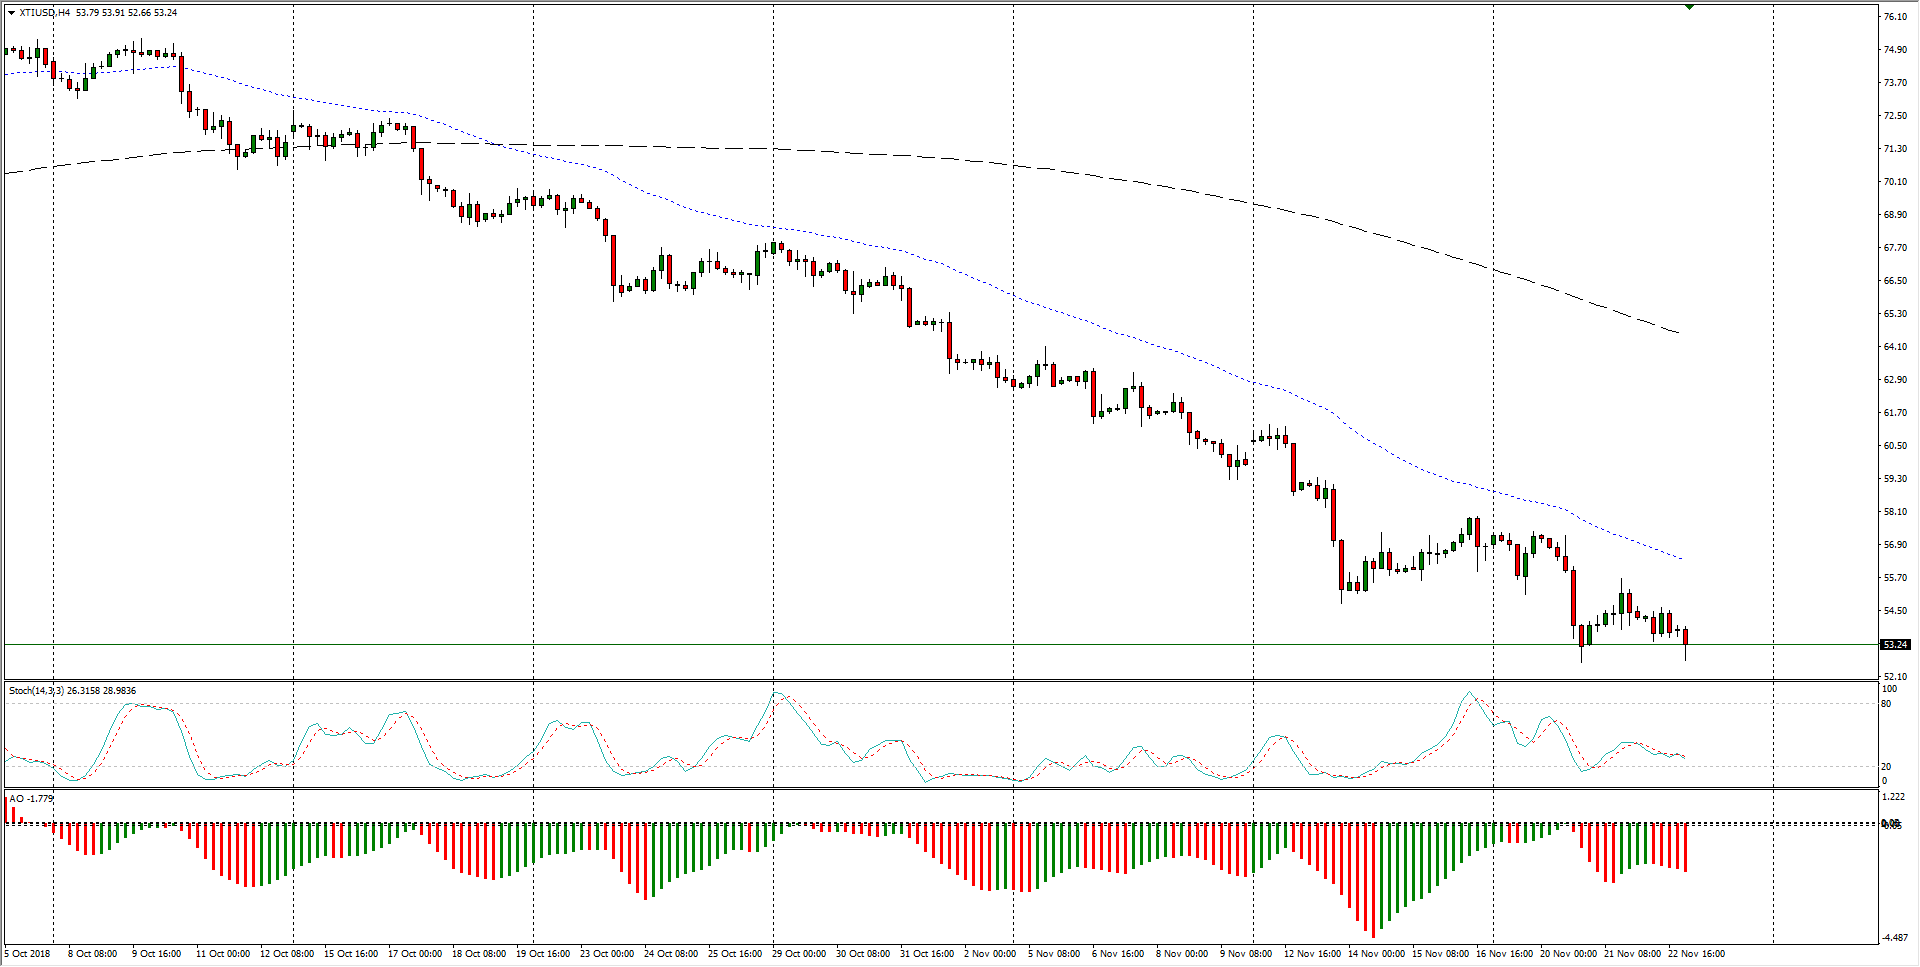
WTI Chart, 4-Hour

WTI

Overview:
    Last Price: 53.38
    Daily change: -62 pips
    Daily change: -1.15%
    Daily Open: 54
Trends:
    Daily SMA20: 59.12
    Daily SMA50: 66.36
    Daily SMA100: 67.46
    Daily SMA200: 68.05
Levels:
    Daily High: 54.09
    Daily Low: 53.84
    Weekly High: 60.93
    Weekly Low: 55.21
    Monthly High: 76.25
    Monthly Low: 64.86
    Daily Fibonacci 38.2%: 53.99
    Daily Fibonacci 61.8%: 53.94
    Daily Pivot Point S1: 53.86
    Daily Pivot Point S2: 53.73
    Daily Pivot Point S3: 53.61
    Daily Pivot Point R1: 54.11
    Daily Pivot Point R2: 54.23
    Daily Pivot Point R3: 54.36

Author

Joshua Gibson

Joshua joins the FXStreet team as an Economics and Finance double major from Vancouver Island University with twelve years' experience as an independent trader focusing on technical analysis.

More from Joshua Gibson
Share:

Editor's Picks

EUR/USD: US Dollar to remain pressured until uncertainty fog dissipates

Unimpressive European Central Bank left monetary policy unchanged for the fifth consecutive meeting. The United States first-tier employment and inflation data is scheduled for the second week of February. EUR/USD battles to remain afloat above 1.1800, sellers moving to the sidelines.

GBP/USD reclaims 1.3600 and above

GBP/USD reverses two straight days of losses, surpassing the key 1.3600 yardstick on Friday. Cable’s rebound comes as the Greenback slips away from two-week highs in response to some profit-taking mood and speculation of Fed rate cuts. In addition, hawkish comments from the BoE’s Pill are also collaborating with the quid’s improvement.

Gold: Volatility persists in commodity space

After losing more than 8% to end the previous week, Gold remained under heavy selling pressure on Monday and dropped toward $4,400. Although XAU/USD staged a decisive rebound afterward, it failed to stabilize above $5,000. The US economic calendar will feature Nonfarm Payrolls and Consumer Price Index data for January, which could influence the market pricing of the Federal Reserve’s policy outlook and impact Gold’s performance.

Week ahead: US NFP and CPI data to shake Fed cut bets, Japan election looms

US NFP and CPI data awaited after Warsh’s nomination as Fed chief. Yen traders lock gaze on Sunday’s snap election. UK and Eurozone Q4 GDP data also on the agenda. China CPI and PPI could reveal more weakness in domestic demand.

Three scenarios for Japanese Yen ahead of snap election

The latest polls point to a dominant win for the ruling bloc at the upcoming Japanese snap election. The larger Sanae Takaichi’s mandate, the more investors fear faster implementation of tax cuts and spending plans. 

XRP rally extends as modest ETF inflows support recovery

Ripple is accelerating its recovery, trading above $1.36 at the time of writing on Friday, as investors adjust their positions following a turbulent week in the broader crypto market. The remittance token is up over 21% from its intraday low of $1.12.