- On Thursday, WTI is advancing 1%, snapping two straight days of losses.
- China’s Covid-19 lockdowns, US oil inventories growing, and Russia’s halting oil and natural-gas flows could bolster WTI prices.
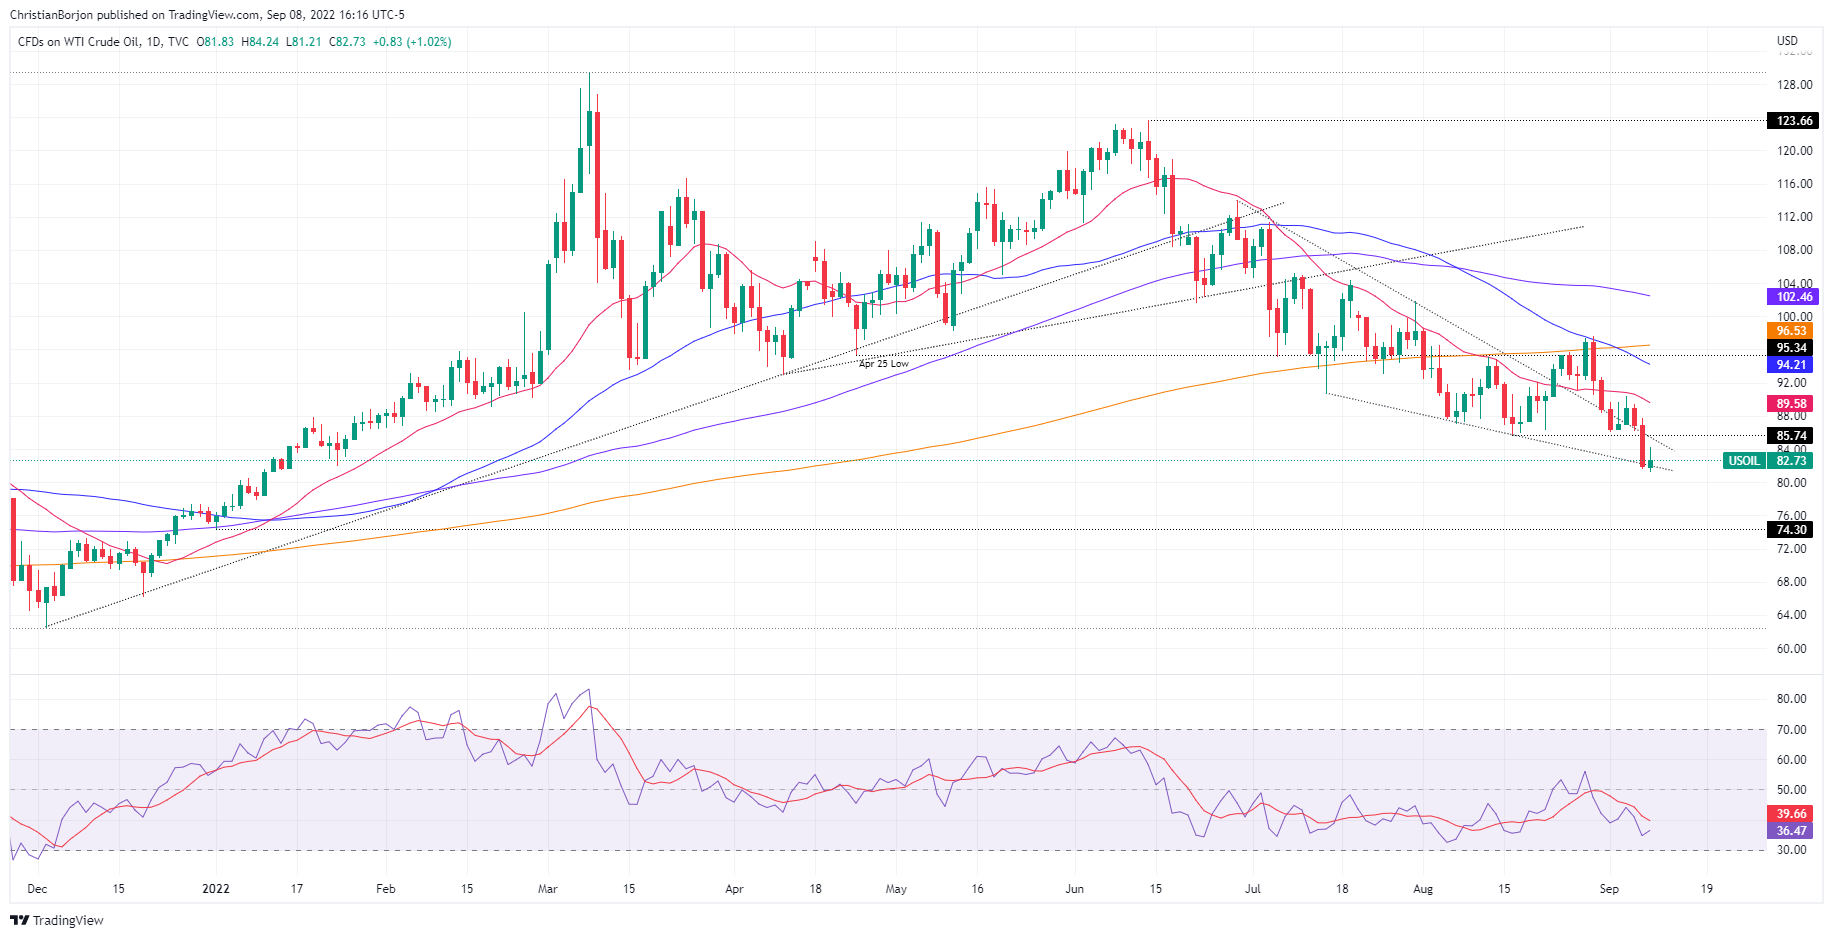
- WTI Price Analysis: Risks are skewed to the downside, but buyers reclaiming $86.00, could pave the way for higher prices.
US crude oil, also known as WTI, advances 1% during Thursday’s trading session after diving to a seven-month-old low at around $81.27 per barrel due to Russia’s halting oil and natural gas exports to some “unfriendly” buyers, while European’s energy crises worsen. At the time of writing, WTI is trading at $82.76, above its opening price.
Factors like China’s Covid-19 concerns, while US stockpiles surprisingly building more than estimates, were only two factors driving the price of the black gold down. Additionally, the US Biden administration is weighing another release of the US Strategic Petroleum Reserve (SPR).
On Wednesday, WTI plunged more than 5%, with Western Texas Intermediate (WTI) testing February’s 2022 lows. Nevertheless, even though initially the price dropped further on Thursday, it bounced off towards the daily highs at $84.24 PB before retracing to current levels.
Sources cited by Reuters attributed the jump in prices to an “oversold technical condition,” which allowed oil to shrug off news of the US stockpiles building, which accounted for nearly 9 million in the last week.
In the meantime, tensions between Europe and Russia keep energy investors uneasy. As the European Union proposed to put a lid on Russia’s oil, Russian President Vladimir Putin threatened to cut off all energy supplies if they advanced toward that path.
WTI Price Analysis: Technical outlook
Oil’s daily chart depicts the black gold as downward biased, despite bouncing from five-month lows. Unless buyers lift prices above the August 16 low-turned-resistance at $85.74 PB, risks are skewed to the downside. If WTI reclaims the latter, a test of the 20-day EMA at $89.58 is on the cards.
On the flip side, WTI’s first support would be the YTD low at $81.27. The break below will expose the $80.00 figure, followed by the January 2 daily low at $74.30.
Information on these pages contains forward-looking statements that involve risks and uncertainties. Markets and instruments profiled on this page are for informational purposes only and should not in any way come across as a recommendation to buy or sell in these assets. You should do your own thorough research before making any investment decisions. FXStreet does not in any way guarantee that this information is free from mistakes, errors, or material misstatements. It also does not guarantee that this information is of a timely nature. Investing in Open Markets involves a great deal of risk, including the loss of all or a portion of your investment, as well as emotional distress. All risks, losses and costs associated with investing, including total loss of principal, are your responsibility. The views and opinions expressed in this article are those of the authors and do not necessarily reflect the official policy or position of FXStreet nor its advertisers. The author will not be held responsible for information that is found at the end of links posted on this page.
If not otherwise explicitly mentioned in the body of the article, at the time of writing, the author has no position in any stock mentioned in this article and no business relationship with any company mentioned. The author has not received compensation for writing this article, other than from FXStreet.
FXStreet and the author do not provide personalized recommendations. The author makes no representations as to the accuracy, completeness, or suitability of this information. FXStreet and the author will not be liable for any errors, omissions or any losses, injuries or damages arising from this information and its display or use. Errors and omissions excepted.
The author and FXStreet are not registered investment advisors and nothing in this article is intended to be investment advice.
Recommended content
Editors’ Picks
EUR/USD edges lower toward 1.0700 post-US PCE

EUR/USD stays under modest bearish pressure but manages to hold above 1.0700 in the American session on Friday. The US Dollar (USD) gathers strength against its rivals after the stronger-than-forecast PCE inflation data, not allowing the pair to gain traction.
GBP/USD retreats to 1.2500 on renewed USD strength

GBP/USD lost its traction and turned negative on the day near 1.2500. Following the stronger-than-expected PCE inflation readings from the US, the USD stays resilient and makes it difficult for the pair to gather recovery momentum.
Gold struggles to hold above $2,350 following US inflation

Gold turned south and declined toward $2,340, erasing a large portion of its daily gains, as the USD benefited from PCE inflation data. The benchmark 10-year US yield, however, stays in negative territory and helps XAU/USD limit its losses.
Bitcoin Weekly Forecast: BTC’s next breakout could propel it to $80,000 Premium

Bitcoin’s recent price consolidation could be nearing its end as technical indicators and on-chain metrics suggest a potential upward breakout. However, this move would not be straightforward and could punish impatient investors.
Week ahead – Hawkish risk as Fed and NFP on tap, Eurozone data eyed too

Fed meets on Wednesday as US inflation stays elevated. Will Friday’s jobs report bring relief or more angst for the markets? Eurozone flash GDP and CPI numbers in focus for the Euro.