|

WTI Price Analysis: Oil hits two-month low

  • WTI crude hits the lowest level in two months. 
  • The bearish momentum looks strong, as per technical studies. 

West Texas Intermediate (WTI), a North American crude oil benchmark, fell to $38.55 on Tuesday – the lowest since July 10. 

At the current price of $39, the black gold is down 10.4% from $43.57 – the high of the bearish inverted hammer candle created on July 31. That candlestick pattern had warned of an impending sell-off. 

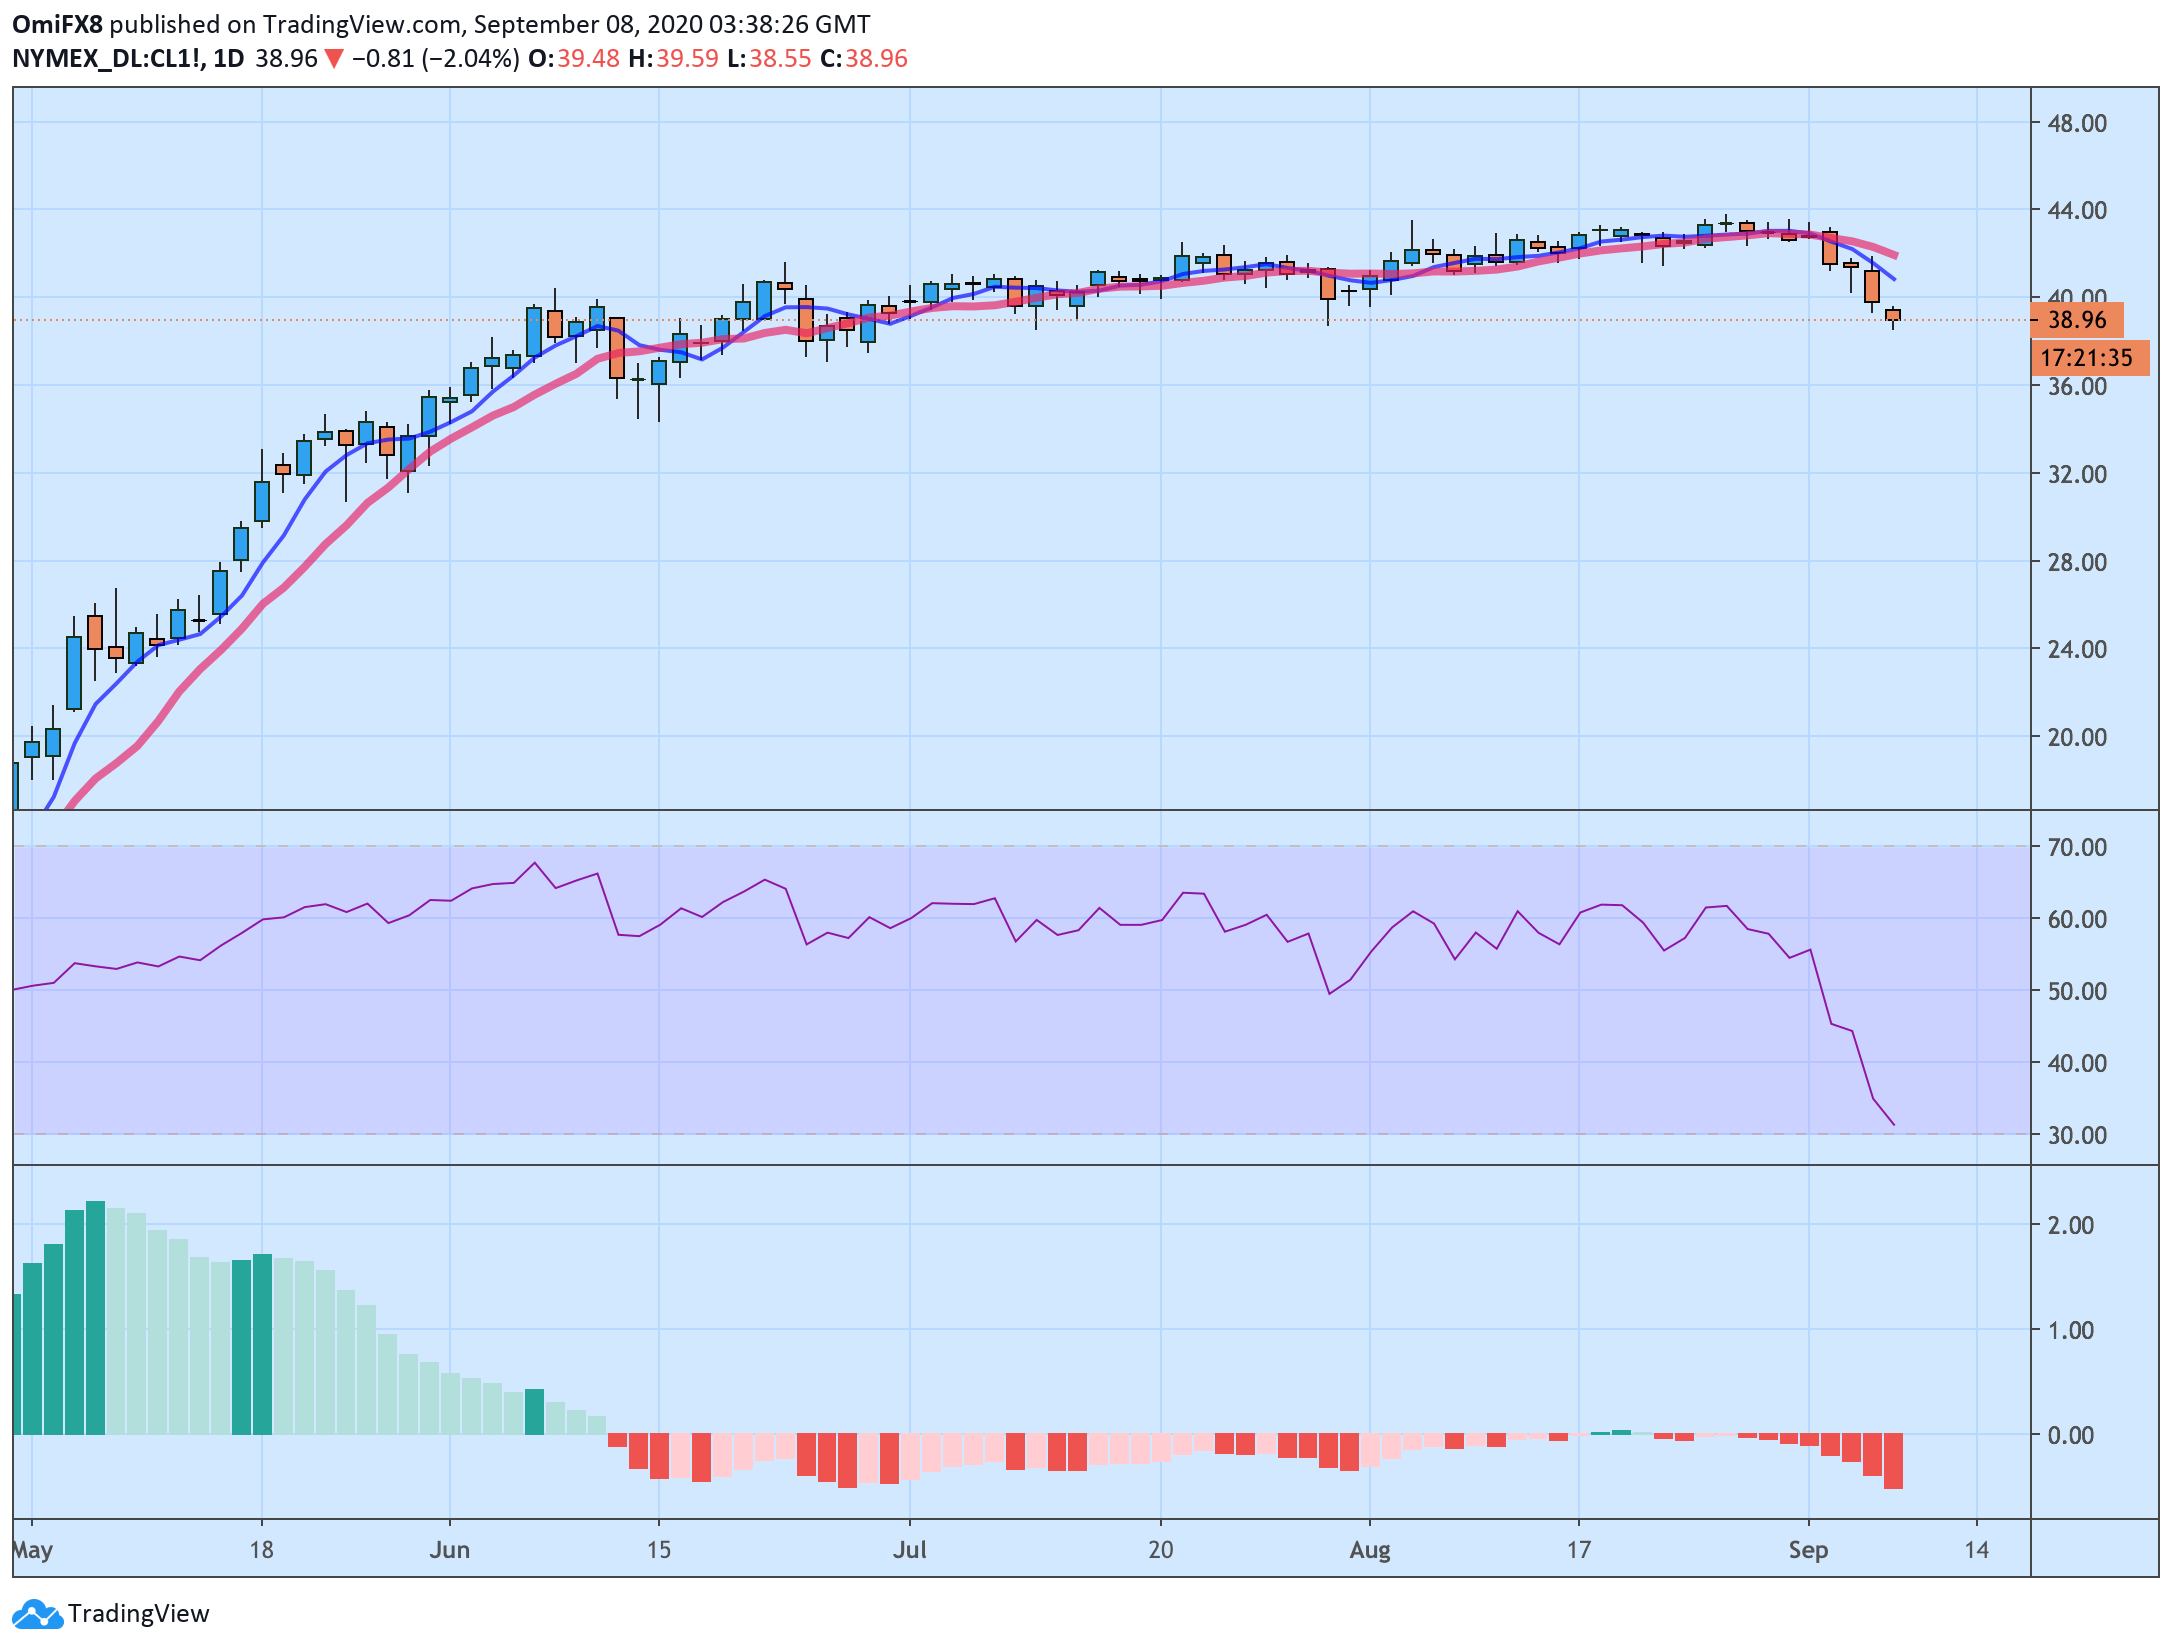
More importantly, the price drop could be extended this week, as the daily chart MACD histogram is now printing deeper bars below the zero line. That's a sign of the strengthening of downward momentum. 
 
The 14-day RSI is signaling bearish conditions with a below-50 print, and the 5- and 10-day simple moving averages are trending south, indicating a bearish setup. 

On the downside, key supports are seen at $38.54 (July 10 low) and $37.08 (June 25 low). Alternatively, resistances are located at $40 (psychological level) and $41.97 (10-day SMA). A close above the 10-day SMA is needed to invalidate the bearish bias

Daily chart

Trend: Bearish

Technical levels

WTI

Overview
Today last price39.21
Today Daily Change-0.20
Today Daily Change %-0.51
Today daily open39.41
 
Trends
Daily SMA2042.39
Daily SMA5041.54
Daily SMA10036.29
Daily SMA20041.78
 
Levels
Previous Daily High39.78
Previous Daily Low38.8
Previous Weekly High43.7
Previous Weekly Low39.61
Previous Monthly High43.86
Previous Monthly Low39.75
Daily Fibonacci 38.2%39.18
Daily Fibonacci 61.8%39.41
Daily Pivot Point S138.88
Daily Pivot Point S238.35
Daily Pivot Point S337.9
Daily Pivot Point R139.86
Daily Pivot Point R240.31
Daily Pivot Point R340.85

Author

Omkar Godbole

Omkar Godbole

FXStreet Contributor

Omkar Godbole, editor and analyst, joined FXStreet after four years as a research analyst at several Indian brokerage companies.

More from Omkar Godbole
Share:

Markets move fast. We move first.

Orange Juice Newsletter brings you expert driven insights - not headlines. Every day on your inbox.

By subscribing you agree to our Terms and conditions.

Editor's Picks

EUR/USD holds steady below 1.1800

EUR/USD moves sideways in a narrow channel below 1.1800 as the market volatility remains low ahead of the New Year holiday. On Tuesday, investors will pay close attention to the minutes of the Federal Reserve's December policy meeting.

GBP/USD retreats below 1.3500 as trading conditions remain thin

GBP/USD corrects lower after posting strong gains in the previous week and trades below 1.3500 on Monday. With the action in financial markets turning subdued following the Christmas holiday, however, the pair's losses remain limited.

Gold holds above $4,300 after profit taking kicked in

Gold retreats sharply from the record-peak it set at $4,550 and trades below $4,400, losing more than 3% on the day. Growing optimism about a Ukraine-Russia peace agreement and profit-taking ahead of the New Year holiday seem to be causing XAU/USD to stay under heavy bearish pressure.

Bitcoin, Ethereum, and XRP bulls regain strength

Bitcoin, Ethereum, and Ripple record roughly 3% gains on Monday, regaining strength mid-holiday season. Despite thin liquidity in the holiday season, BTC and major altcoins are regaining strength as US President Donald Trump pushes peace talks between Russia and Ukraine. The technical outlook for Bitcoin, Ethereum, and Ripple gradually shifts bullish as selling pressure wanes.

Economic outlook 2026-2027 in advanced countries: Solidity test

After a year marked by global economic resilience and ending on a note of optimism, 2026 looks promising and could be a year of solid economic performance. In our baseline scenario, we expect most of the supportive factors at work in 2025 to continue to play a role in 2026.

Crypto market outlook for 2026

Year 2025 was volatile, as crypto often is.  Among positive catalysts were favourable regulatory changes in the U.S., rise of Digital Asset Treasuries (DAT), adoption of AI and tokenization of Real-World-Assets (RWA).