WTI Price Analysis: Oil hits 2.5-year high, weekly chart shows a bullish breakout

WTI extends previous week's gain, clocks fresh 13-month high.
Oil has violated a 2-1/2-year-long bearish trendline.
West Texas Intermediate (WTI) crude, a North American oil benchmark, rose to $57.50 on Monday – the highest level since January 2020.
Prices jumped nearly 9% last week – the biggest single-week gain since October 2020 – confirming an upside break of the trendline falling from October 2018 and January 2020 highs.
The breakout has exposed resistances at $60 (psychological level) and $65.65 (lower high created in January 2020).
However, a pullback may be seen before a continued rally, as the daily and weekly chart Relative Strength Indices are hovering above 70.00, indicating overbought conditions.
The ascending 10-day Simple Moving Average, currently at $54.64, is a key support to watch out for in the short-term.
Weekly chart
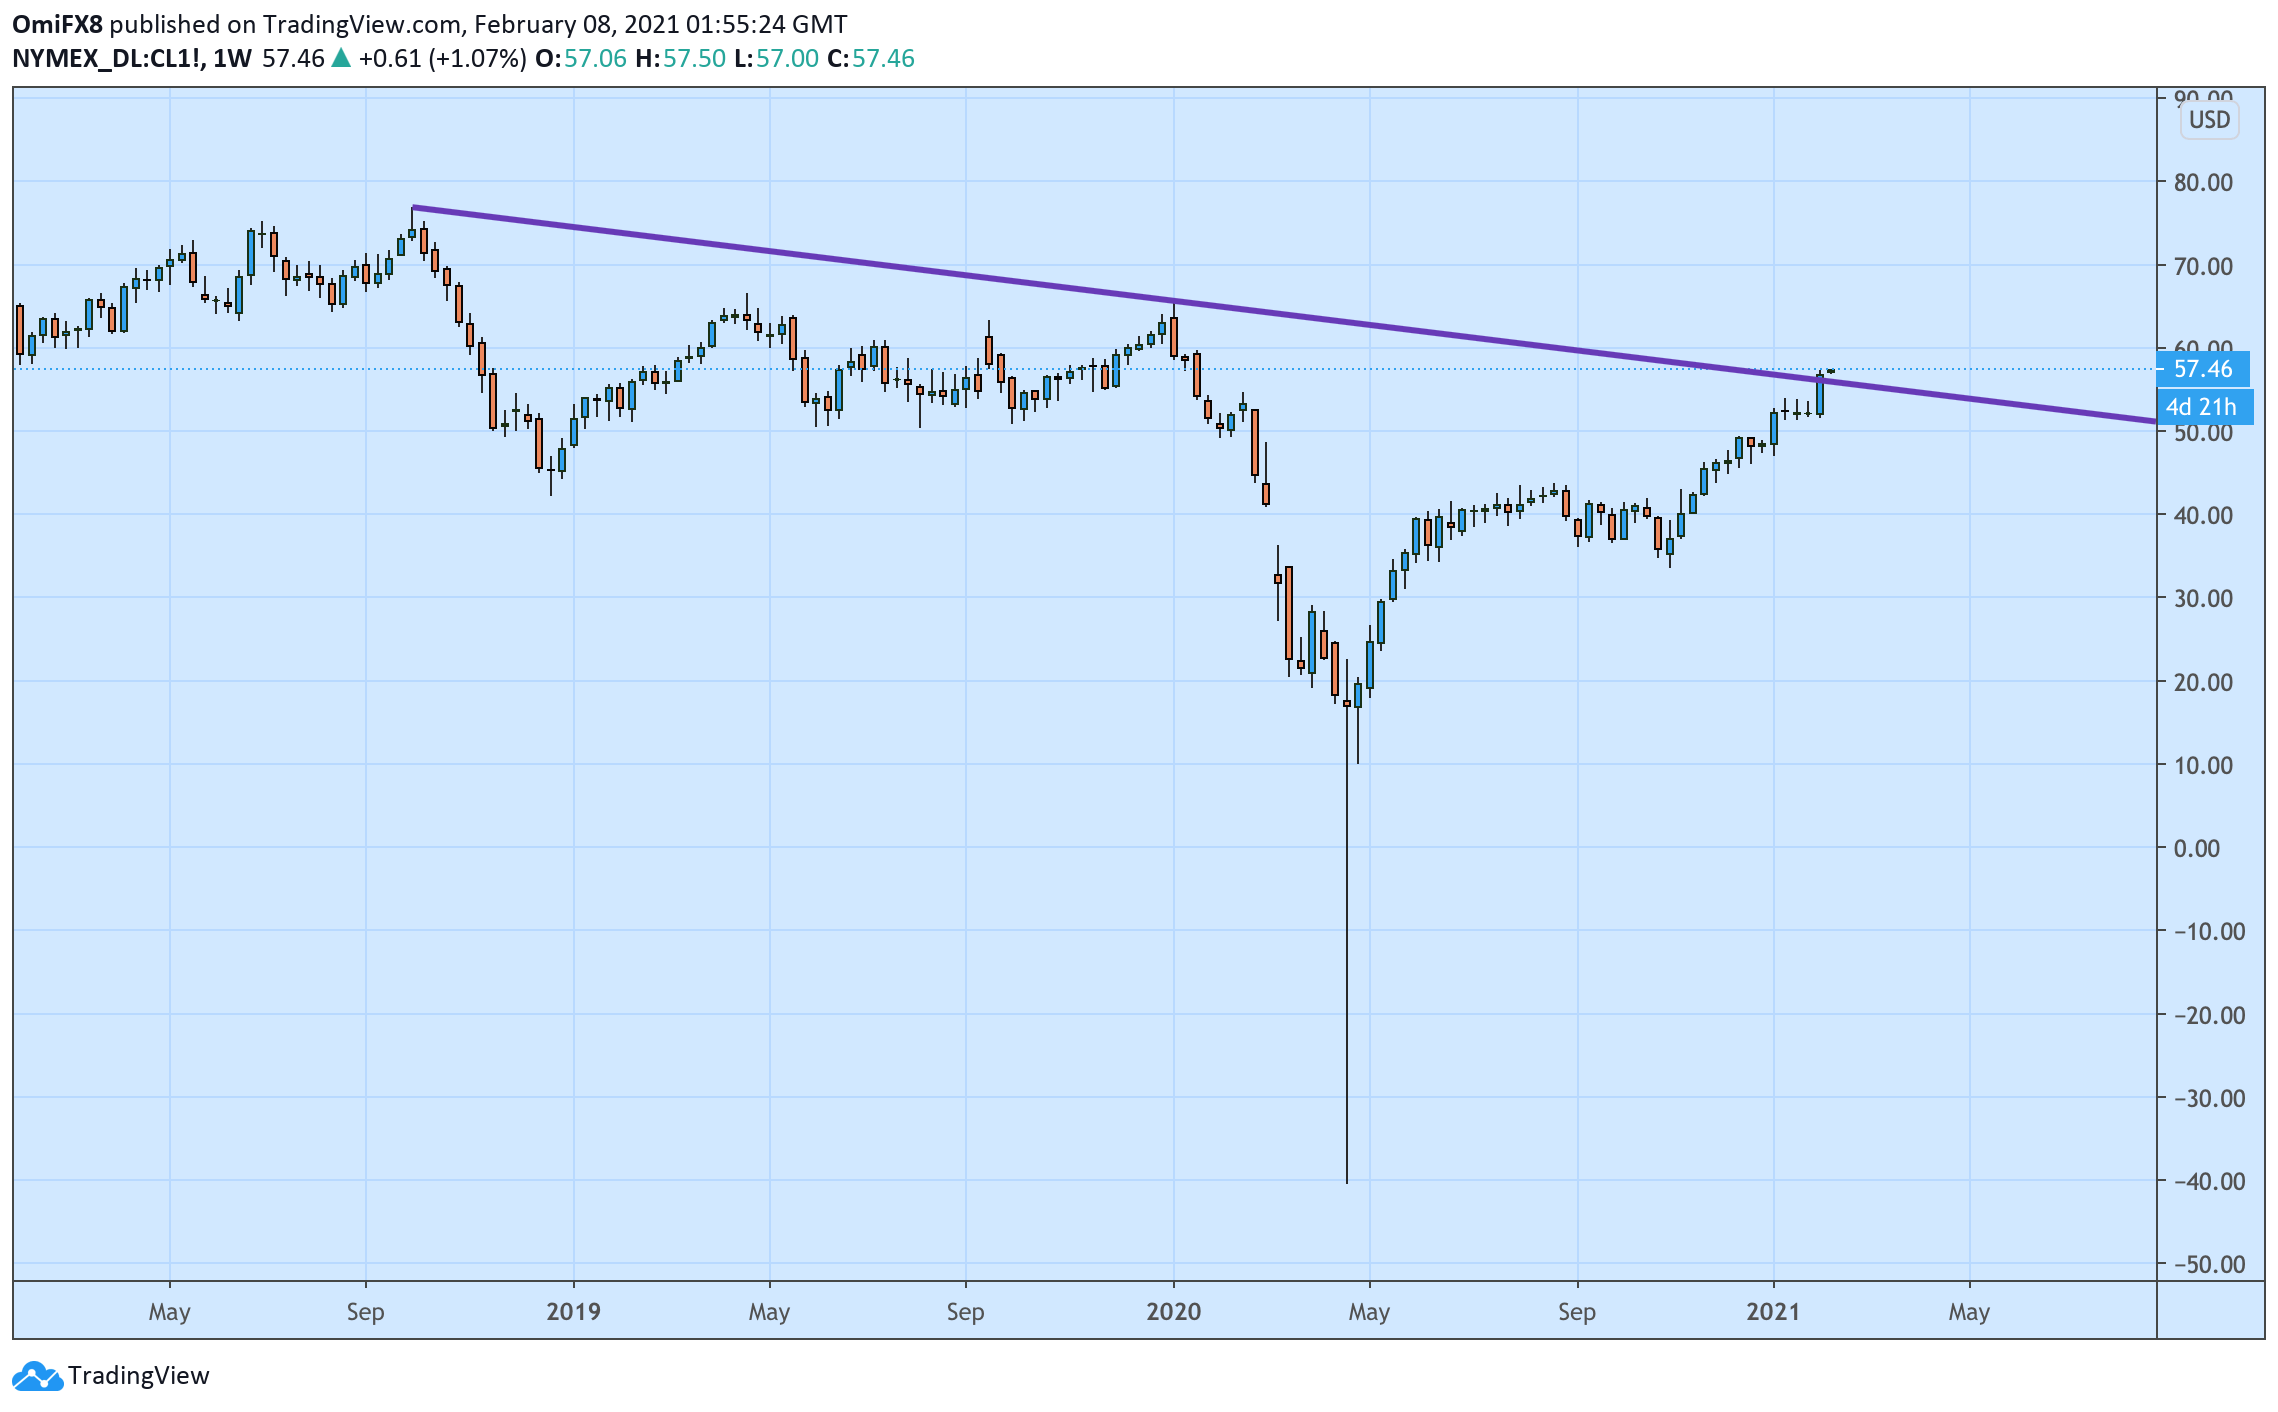
Trend: Bullish
Technical levels
Author

Omkar Godbole
FXStreet Contributor
Omkar Godbole, editor and analyst, joined FXStreet after four years as a research analyst at several Indian brokerage companies.


