|

WTI Price Analysis: Oil bears need $69.60 break to retake controls

  • WTI remains pressured around intraday low, extends pullback from early August highs.
  • Monthly support line, 100-SMA challenge sellers amid bearish MACD.
  • Weekly resistance line, 12-day-old rising trend line adds to the upside filters.

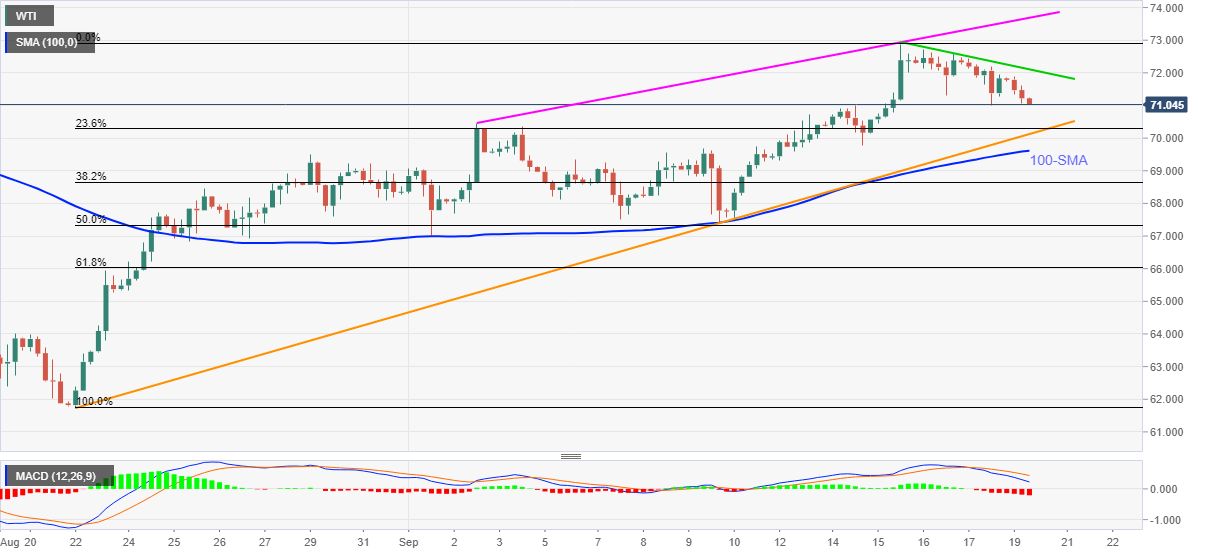
WTI justifies Thursday’s Doji candlestick while taking offers around $71.15, down 0.90% intraday, heading into Monday’s European session open.

Although a short-term falling trend line and bearish MACD hints at the black gold’s further weakness, an ascending trend line from August 22 near $70.10 and the $70.00 threshold, not to forget the 100-SMA level of $69.90, will challenge the bears.

In a case where WTI drops below $69.60, the bearish momentum can aim for the monthly low surrounding $67.00, also including 50% Fibonacci retracement of August-September upside.

On the contrary, a downward sloping resistance line from last Wednesday, near $72.10, challenges the WTI recovery moves ahead of the monthly peak surrounding $72.90.

If the oil buyers keep reins past $72.90, an ascending trend line from September 02 near $73.70 will flash on their radars.

WTI: Four-hour chart

Trend: Pullback expected

Additional important levels

Overview
Today last price71.17
Today Daily Change-0.62
Today Daily Change %-0.86%
Today daily open71.79
 
Trends
Daily SMA2069.1
Daily SMA5069.27
Daily SMA10069.14
Daily SMA20063.16
 
Levels
Previous Daily High72.47
Previous Daily Low71.01
Previous Weekly High72.88
Previous Weekly Low69.3
Previous Monthly High73.54
Previous Monthly Low61.73
Daily Fibonacci 38.2%71.57
Daily Fibonacci 61.8%71.91
Daily Pivot Point S171.04
Daily Pivot Point S270.3
Daily Pivot Point S369.58
Daily Pivot Point R172.5
Daily Pivot Point R273.22
Daily Pivot Point R373.96

Author

Anil Panchal

Anil Panchal

FXStreet

Anil Panchal has nearly 15 years of experience in tracking financial markets. With a keen interest in macroeconomics, Anil aptly tracks global news/updates and stays well-informed about the global financial moves and their implications.

More from Anil Panchal
Share:

Editor's Picks

EUR/USD holds above 1.1750 after mixed PMI data

EUR/USD manages to hold above 1.1750 but struggles to gather recovery momentum on Friday, following the mixed February PMI figures from Germany and the Eurozone. In the second half of the day, Q4 GDP, December inflation and February PMI data from the US will be watched closely by market participants.

GBP/USD recovers above 1.3450 ahead of UK PMI data

GBP/USD is recovering ground above 1.3450 in European trading on Friday, helped by a modest uptick in the Pound Sterling after a bigger-than-expected increase in the UK Retail Sales for January. However, the further upside appears limited in the pair amid persistent US Dollar strength and ahead of key UK and US data. 

Gold rises for third day on geopolitical risks, US data eyed

Gold gains some positive traction for the third consecutive day on Friday. The upside potential, however, seems limited amid the mixed fundamental backdrop. Moreover, traders might opt to wait for the key US macro releases – the Advance Q4 GDP report and the Personal Consumption Expenditures (PCE) Price Index – before placing fresh directional bets.

US GDP growth expected to slow down significantly in Q4 after stellar Q3 

The United States Bureau of Economic Analysis will publish the first preliminary estimate of the fourth-quarter Gross Domestic Product at 13:30 GMT. Analysts forecast the US economy to have expanded at a 3% annualized rate, slowing down from the 4.4% growth posted in the previous quarter.

Hawkish Fed minutes and a market finding its footing

It was green across the board for US Stock market indexes at the close on Wednesday, with most S&P 500 names ending higher, adding 38 points (0.6%) to 6,881 overall. At the GICS sector level, energy led gains, followed by technology and consumer discretionary, while utilities and real estate posted the largest losses.

Official Trump price approaches breakout with mixed signals from traders

Official Trump (TRUMP) is trading at $3.50 at the time of writing, approaching its upper consolidation range. A breakout from this range could open the door for an upside move. On-chain data shows market indecision, with balanced flows between bulls and bears, signaling a lack of clear directional bias.