|

WTI Price Analysis: Hangs near weekly lows, just above $64.00 mark

  • WTI witnessed some selling for the fifth consecutive session on Thursday.
  • Descending channel formation supports prospects for further weakness.
  • Mixed technical indicators warrant caution for aggressive bearish traders.

WTI crude oil edged lower for the fifth consecutive session on Thursday and was last seen hovering near the lower boundary of its weekly trading range, around the $64.00/barrel mark.

The commodity was weighed down by Wednesday's EIA report, which showed a build in US crude inventories for the fourth straight week. This comes on the back of worries about slowing fuel demand amid a spike in newly reported cases and the suspension of coronavirus vaccine rollouts in Europe.

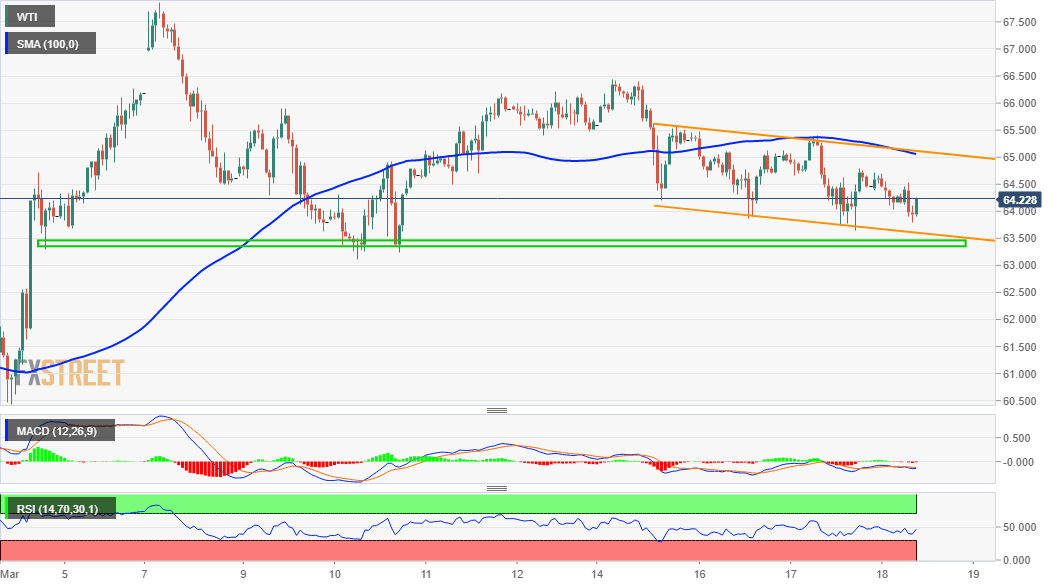
Looking at the technical picture, oil prices have been trending lower along a downward sloping channel since the beginning of this week. Given the overnight rejection near the trend-channel hurdle, which coincides with 100-hour SMA, the near-term bias seems tilted in favour of bearish traders.

The bearish outlook is reinforced by the fact that technical indicators on hourly charts have been gained negative momentum. That said, oscillators on the daily chart are still holding in the bullish territory and support prospects for the emergence of some dip-buying at lower levels.

Hence, any subsequent fall is more likely to find decent support near the $63.50-40 horizontal level. This also marks the lower boundary of the mentioned channel, which if broken decisively will be seen as a fresh trigger for bearish traders and set the stage for additional weakness.

Oil prices might then turn vulnerable to break below the $63.00 level and extend the recent pullback from the $68.00 mark, or over one-year tops touched earlier this month. The next relevant bearish target is pegged near the $62.00 mark with some intermediate support around the $62.40 area.

On the upside, any meaningful positive move now seems to confront stiff resistance and seen as a selling opportunity near daily swing highs, around the $64.70 region. This should cap the upside near the trend-channel/100-hour SMA confluence hurdle, just ahead of the $65.00 psychological mark.

WTI 1-hourly chart

fxsoriginal

Technical levels to watch

WTI

Overview
Today last price64.23
Today Daily Change-0.22
Today Daily Change %-0.34
Today daily open64.45
 
Trends
Daily SMA2063.07
Daily SMA5058.1
Daily SMA10051.34
Daily SMA20045.9
 
Levels
Previous Daily High65.4
Previous Daily Low63.64
Previous Weekly High67.87
Previous Weekly Low63.11
Previous Monthly High63.72
Previous Monthly Low51.6
Daily Fibonacci 38.2%64.31
Daily Fibonacci 61.8%64.73
Daily Pivot Point S163.6
Daily Pivot Point S262.74
Daily Pivot Point S361.84
Daily Pivot Point R165.35
Daily Pivot Point R266.25
Daily Pivot Point R367.11

Author

Haresh Menghani

Haresh Menghani is a detail-oriented professional with 10+ years of extensive experience in analysing the global financial markets.

More from Haresh Menghani
Share:

Markets move fast. We move first.

Orange Juice Newsletter brings you expert driven insights - not headlines. Every day on your inbox.

By subscribing you agree to our Terms and conditions.

Editor's Picks

EUR/USD falls toward 1.1700 on broad USD recovery

EUR/USD turns south and declines toward 1.1700 on Wednesday. The US Dollar gathers recovery momentum and forces the pair to stay on the back foor, as traders look to USD short-covering ahead of US inflation report on Thursday. However, the downside could be capped by hawkish ECB expectations. 

GBP/USD trades deep in red below 1.3350 after soft UK inflation data

GBP/USD stays under strong selling pressure midweek and trades below 1.3350. The UK annual headline and core CPI rose by 3.2% each, missing estimates of 3.5% and 3.4%, respectively, reaffirming dovish BoE expectations and smashing the Pound Sterling across the board ahead of Thurday's BoE policy announcements. 

Gold clings to moderate daily gains above $4,300

Following Tuesday's volatile action, Gold regains its traction on Wednesday and trades in positive territory above $4,300. While the buildup in the USD recovery momentum caps XAU/USD's upside, the cautious market stance helps the pair hold its ground.

Bitcoin risks deeper correction as ETF outflows mount, derivative traders stay on the sidelines

Bitcoin (BTC) remains under pressure, trading below $87,000 on Wednesday, nearing a key support level. A decisive daily close below this zone could open the door to a deeper correction.

Monetary policy: Three central banks, three decisions, the same caution

While the Fed eased its monetary policy on 10 December for the third consecutive FOMC meeting, without making any guarantees about future action, the BoE, the ECB and the BoJ are holding their respective meetings this week. 

AAVE slips below $186 as bearish signals outweigh the SEC investigation closure

Aave (AAVE) price continues its decline, trading below $186 at the time of writing on Wednesday after a rejection at the key resistance zone. Derivatives positioning and momentum indicators suggest that bearish forces still dominate in the near term.