|

WTI Price Analysis: Eases from six-week top above $72.00 but bulls stay hopeful

  • WTI snaps four-day uptrend, steps back from the highest levels since early August.
  • Bullish MACD, sustained break of the key trend lines and 100-DMA favor buyers.

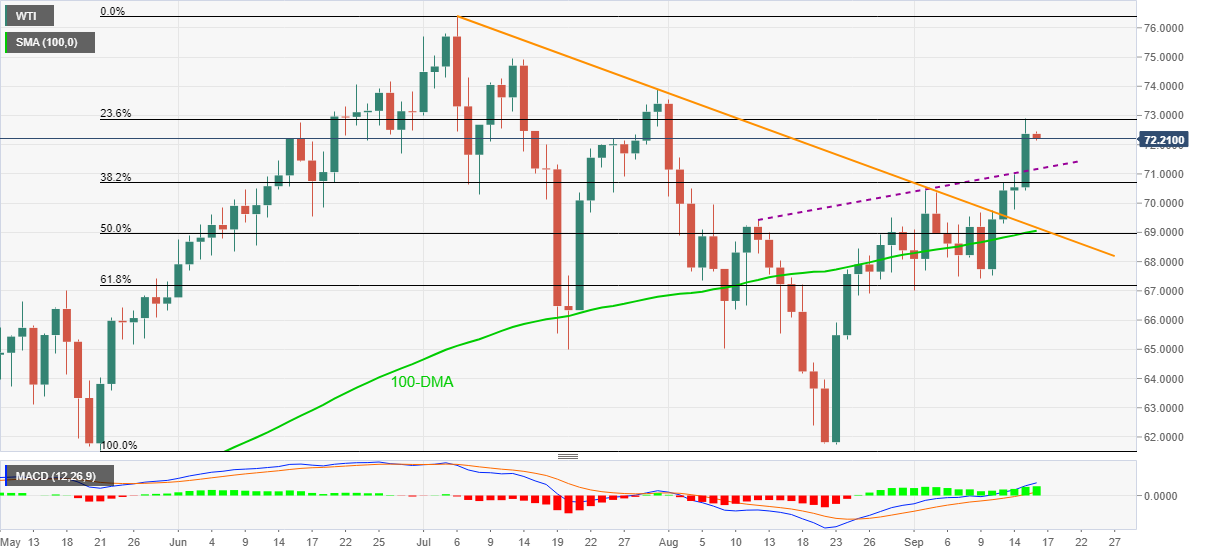
WTI consolidates weekly gains around multi-day high, 0.20% intraday near $72.20 during early Thursday. The oil benchmark jumped to the highest level since August 02 but failed to cross 23.6% Fibonacci retracement of May–July upside.

Even so, bullish MACD and the commodity’s ability to cross monthly resistance line, descending trend line from early July, also stay firmer beyond 100-DMA, keep WTI oil buyers hopeful.

During further pullback, an ascending resistance-turned-support line from August 12, near $71.15 offers immediate support ahead of the downward sloping trend line from July close to $69.20-15.

It’s worth noting that the $70.00 threshold and 100-DMA, around $69.00, add to the downside filters for the energy benchmark.

Meanwhile, an upside clearance of the 23.6% Fibonacci retracement level of $72.85 will aim for July 30 top of $73.88 and the mid-July peak surrounding $75.00.

However, a sustained run-up beyond the $75.00 round figure won’t hesitate to challenge the yearly top marked in July around $76.40.

WTI: Daily chart

Trend: Bullish

Additional important levels

Overview
Today last price72.21
Today Daily Change-0.16
Today Daily Change %-0.22%
Today daily open72.37
 
Trends
Daily SMA2068.17
Daily SMA5069.32
Daily SMA10068.99
Daily SMA20062.9
 
Levels
Previous Daily High72.88
Previous Daily Low70.44
Previous Weekly High69.75
Previous Weekly Low67.41
Previous Monthly High73.54
Previous Monthly Low61.73
Daily Fibonacci 38.2%71.95
Daily Fibonacci 61.8%71.37
Daily Pivot Point S170.91
Daily Pivot Point S269.45
Daily Pivot Point S368.46
Daily Pivot Point R173.36
Daily Pivot Point R274.34
Daily Pivot Point R375.8

Author

Anil Panchal

Anil Panchal

FXStreet

Anil Panchal has nearly 15 years of experience in tracking financial markets. With a keen interest in macroeconomics, Anil aptly tracks global news/updates and stays well-informed about the global financial moves and their implications.

More from Anil Panchal
Share:

Editor's Picks

EUR/USD falls to near 1.1600 due to persistent bearish bias

EUR/USD depreciates after registering modest gains in the previous session, trading around 1.1610 during the Asian hours on Thursday. The technical analysis of the daily chart suggests a persistent bearish bias as the EUR/USD pair remains within the descending channel pattern.

GBP/USD underperforms as UK faces stagflation risks amid Middle East war

The Pound Sterling trades lower against its major currency peers, is down 0.22% around 1.3340 against the US Dollar, during the Asian trade on Thursday. The British currency faces selling pressures amid fears that the United Kingdom economy could face stagflation risks due to higher energy prices, a situation in which inflation accelerates with economic growth and employment conditions remaining stagnant.

Gold climbs near $5,200 as Iran war fuels safe-haven demand

Gold price extends its gains for the second successive session on Thursday as traders seek safety amid the ongoing war in the Middle East. US and Israeli strikes across Iranian territory and widespread Iranian missile and drone retaliation across the Middle East, including attacks on regional targets and military sites, prolong the crisis and its impact.

Top Crypto Gainers: Decred, Zcash, and Dogecoin lead recovery as Bitcoin crosses $72,000

Bitcoin trades above $72,500 at press time on Thursday, holding its 6% gain from the previous day, contributing to a broader market recovery. The total cryptocurrency market capitalization stands at over $2.43 trillion as the broader market sentiment improves significantly.

First Venezuela, now Iran: The US-China energy war escalates

At first glance, the latest escalation involving the United States with both Iran and Venezuela looks like another chapter in a long-running geopolitical story. But viewed through a broader strategic lens, something else may be unfolding: Energy.

Cardano Price Analysis: Approaches key trendline amid bearish sentiment

Cardano (ADA) price is approaching its descending trendline around $0.28 at the time of writing, set to shape the next directional move. The derivatives metrics paint a bearish picture, with ADA’s Open Interest continuing to fall and short bets rising among traders.