WTI Price Analysis: Double top on daily chart, 100-DMA offers immediate support
- WTI sees bearish reversal after double top formed on daily sticks.
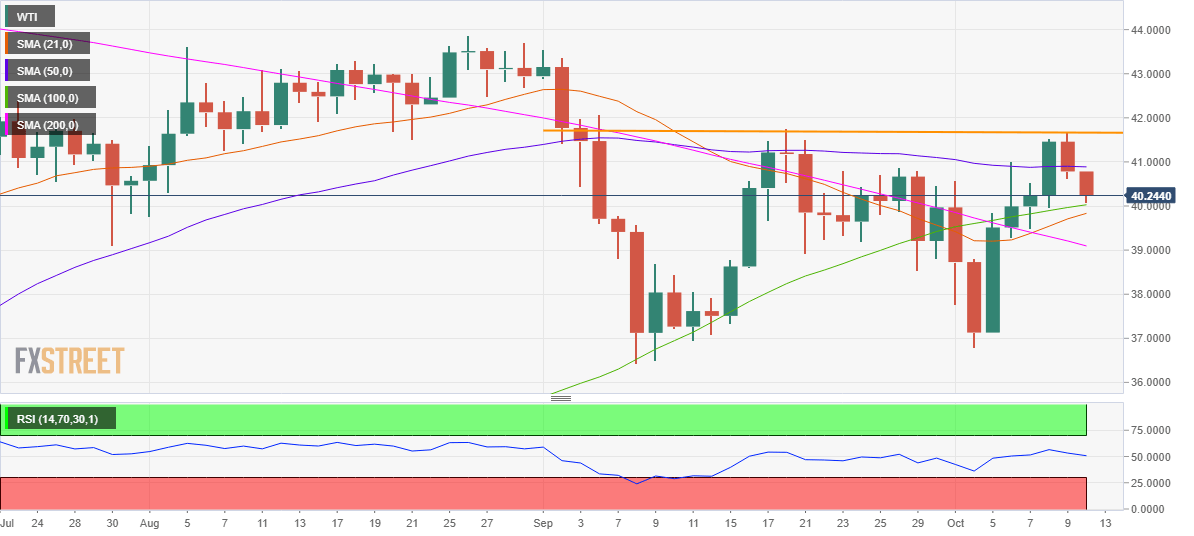
- Daily RSI points south while off the bearish region.
- 100-DMA at 40.03 to challenge bears’ commitment.

WTI (futures on NYMEX) extends its run of losses into a second straight day on Monday, in the face of a bearish reversal, which ensued after the price formed a double top formation on the daily chart.
The US oil faced rejection around 41.70 on September 18 and October 9, carving out a double top pattern. On its way south, the WTI barrel breached the 50-daily moving average (DMA) at 40.88 and now looks to test the next critical support of the 100-DMA at 40.03.
Acceptance under the 100-DMA could call for a test of the upward-sloping 21-DMA at 39.83. The next downside target is aligned at 39.09, which is the 200-DMA support.
On the flip side, the bulls need to recapture the 50-DMA support-turned-resistance to challenge the horizontal trendline (orange) barrier at 41.70.
The 14-day Relative Strength Index (RSI) points south, still holds above the midline, suggesting that the bearish bias could be losing momentum in the near-term.
WTI daily chart
WTI additional levels
Author

Dhwani Mehta
FXStreet
Residing in Mumbai (India), Dhwani is a Senior Analyst and Manager of the Asian session at FXStreet. She has over 10 years of experience in analyzing and covering the global financial markets, with specialization in Forex and commodities markets.


