WTI Price Analysis: Bulls battle 100, 200-HMA above $80.00
- WTI extends bounce off one-week low, refreshes intraday high of late.
- Overbought RSI conditions, key moving averages challenge buyers.
- Bears have a bumpy road to entry, 61.8% Fibonacci retracement tests pullback.

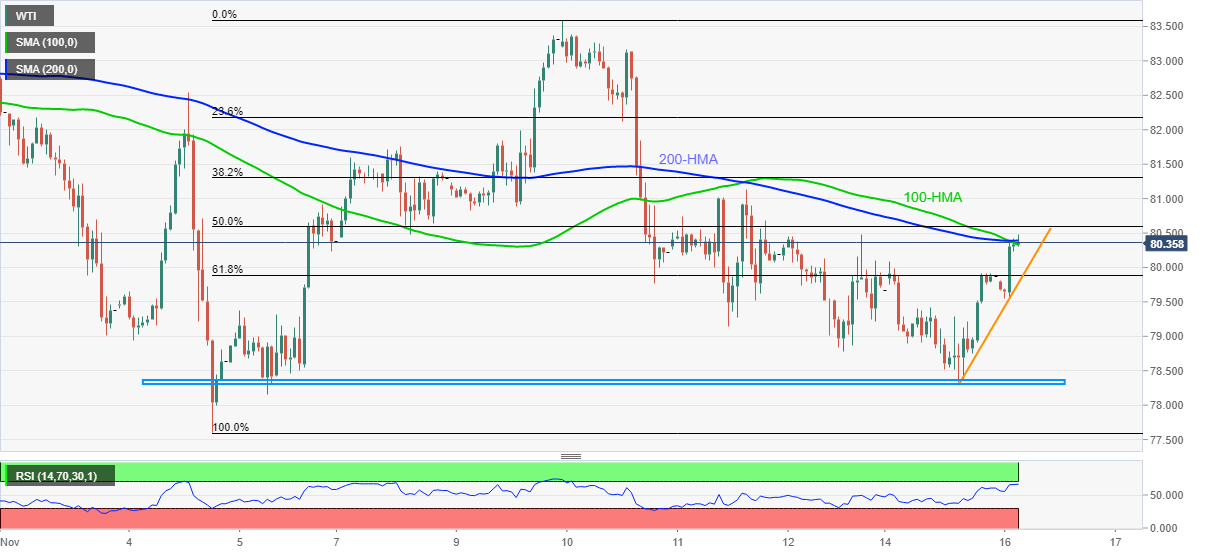
WTI crude oil takes the bids around $80.40, up 0.77% intraday, heading into Tuesday’s European session.
In doing so, the black gold buyers attack a convergence of the 100-HMA and 200-HMA while extending the rebound from one-week low, marked the previous day.
Given the overbought RSI conditions challenging the upside momentum around the key moving averages, around $80.40 at the latest, WTI is likely to witness a pullback towards the 61.8% Fibonacci retracement (Fibo.) level of November 04-09 upside, near $79.90.
Following that, an ascending trend line connecting weekly lows, near $79.75, will precede the horizontal area comprising multiple lows marked since November 04, near $78.30, to challenge the oil bears.
On the flip side, the 50% Fibo. around $80.60 and the $81.00 round figure restrict the short-term advances of WTI prices.
In a case where the commodity bulls remain dominant past $81.00, $82.20 will probe the advances targeting the monthly top near $83.60.
To sum up, WTI bulls seem to have tired nut the overall bullish trend remains intact.
WTI: Hourly chart
Trend: Pullback expected
Author

Anil Panchal
FXStreet
Anil Panchal has nearly 15 years of experience in tracking financial markets. With a keen interest in macroeconomics, Anil aptly tracks global news/updates and stays well-informed about the global financial moves and their implications.


