WTI Price Analysis: 200-HMA remains a tough nut to crack for the bulls


  • Sellers return after WTI run into strong offers just below the 200-HMA cap.
  • RSI trades flat while above the bullish zone, keeping buyers hopeful.

WTI (futures on NYMEX) has stalled its recovery rally below the 200-hourly moving average (HMA), now dropping further towards the $59.50 level.

The US oil drew support from the Saudi Arabian Energy Minister Prince Abdulaziz bin Salman’s comments. The Minister expressed confidence that OPEC and its allies (OPEC+) made the right output decision.

At the time of writing, WTI drops to $59.65, looking to test the critical support at $59.60, which is the confluence of the upward-pointing 21-HMA and bearish 100-DMA at $59.60.

A break below the last could expose the 50-HMA at $59.50.

WTI one-hour chart

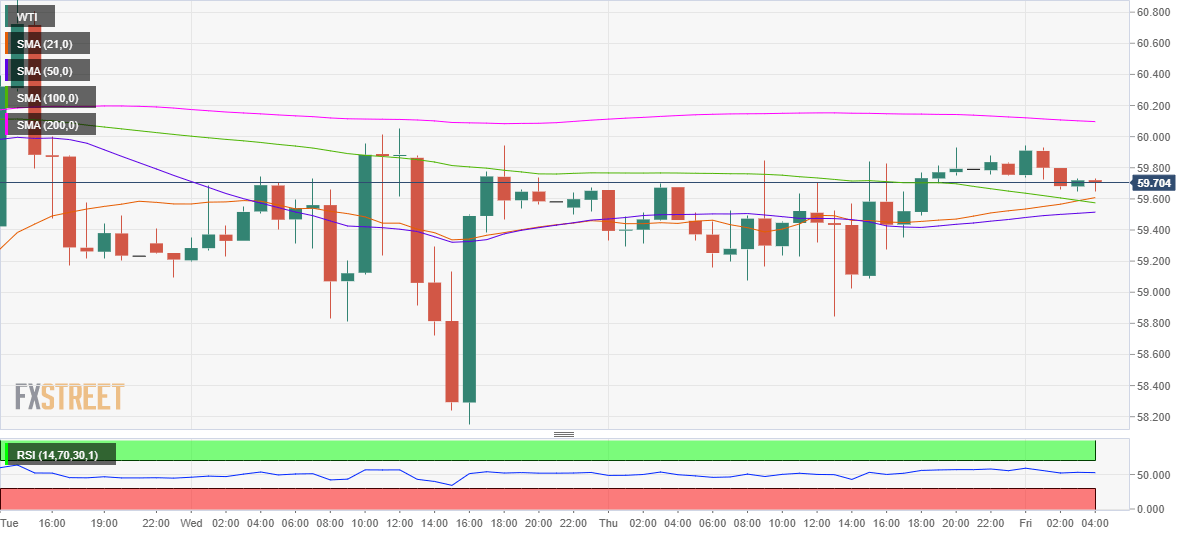
The hourly Relative Strength Index (RSI) has turned south but holds above the central line, currently at 51.93.

Therefore, the upside bias still appears intact. The oil bulls need a sustained break above the horizontal 200-HMA at $60.10 to unleash additional upside.

The next relevant barrier is seen at the psychological $60.50 level.

WTI additional levels

WTI

Overview
Today last price 59.66
Today Daily Change -0.13
Today Daily Change % -0.22
Today daily open 59.79
 
Trends
Daily SMA20 61.32
Daily SMA50 60.33
Daily SMA100 54.41
Daily SMA200 47.5
 
Levels
Previous Daily High 59.93
Previous Daily Low 58.85
Previous Weekly High 62.25
Previous Weekly Low 58.88
Previous Monthly High 67.87
Previous Monthly Low 57.27
Daily Fibonacci 38.2% 59.52
Daily Fibonacci 61.8% 59.26
Daily Pivot Point S1 59.12
Daily Pivot Point S2 58.44
Daily Pivot Point S3 58.03
Daily Pivot Point R1 60.2
Daily Pivot Point R2 60.61
Daily Pivot Point R3 61.28


Share: Feed news

Information on these pages contains forward-looking statements that involve risks and uncertainties. Markets and instruments profiled on this page are for informational purposes only and should not in any way come across as a recommendation to buy or sell in these assets. You should do your own thorough research before making any investment decisions. FXStreet does not in any way guarantee that this information is free from mistakes, errors, or material misstatements. It also does not guarantee that this information is of a timely nature. Investing in Open Markets involves a great deal of risk, including the loss of all or a portion of your investment, as well as emotional distress. All risks, losses and costs associated with investing, including total loss of principal, are your responsibility. The views and opinions expressed in this article are those of the authors and do not necessarily reflect the official policy or position of FXStreet nor its advertisers. The author will not be held responsible for information that is found at the end of links posted on this page.

If not otherwise explicitly mentioned in the body of the article, at the time of writing, the author has no position in any stock mentioned in this article and no business relationship with any company mentioned. The author has not received compensation for writing this article, other than from FXStreet.

FXStreet and the author do not provide personalized recommendations. The author makes no representations as to the accuracy, completeness, or suitability of this information. FXStreet and the author will not be liable for any errors, omissions or any losses, injuries or damages arising from this information and its display or use. Errors and omissions excepted.

The author and FXStreet are not registered investment advisors and nothing in this article is intended to be investment advice.

Recommended content


Recommended content

Editors’ Picks

EUR/USD alternates gains with losses near 1.0720 post-US PCE

EUR/USD alternates gains with losses near 1.0720 post-US PCE

The bullish tone in the Greenback motivates EUR/USD to maintain its daily range in the low 1.070s in the wake of firmer-than-estimated US inflation data measured by the PCE.

EUR/USD News

GBP/USD clings to gains just above 1.2500 on US PCE

GBP/USD clings to gains just above 1.2500 on US PCE

GBP/USD keeps its uptrend unchanged and navigates the area beyond 1.2500 the figure amidst slight gains in the US Dollar following the release of US inflation tracked by the PCE.

GBP/USD News

Gold keeps its daily gains near $2,350 following US inflation

Gold keeps its daily gains near $2,350 following US inflation

Gold prices maintain their constructive bias around $2,350 after US inflation data gauged by the PCE surpassed consensus in March and US yields trade with slight losses following recent peaks.

Gold News

Bitcoin Weekly Forecast: BTC’s next breakout could propel it to $80,000 Premium

Bitcoin Weekly Forecast: BTC’s next breakout could propel it to $80,000

Bitcoin’s recent price consolidation could be nearing its end as technical indicators and on-chain metrics suggest a potential upward breakout. However, this move would not be straightforward and could punish impatient investors. 

Read more

Week ahead – Hawkish risk as Fed and NFP on tap, Eurozone data eyed too

Week ahead – Hawkish risk as Fed and NFP on tap, Eurozone data eyed too

Fed meets on Wednesday as US inflation stays elevated. Will Friday’s jobs report bring relief or more angst for the markets? Eurozone flash GDP and CPI numbers in focus for the Euro.

Read more

Forex MAJORS

Cryptocurrencies

Signatures