WTI Crude Oil slips back into $72.00 despite Middle East tension, US crude stocks decline
- US gasoline inventories surged on Thursday, eating away at EIA Crude Oil inventory decline.
- Front-loaded oversupply set to continue pressing Crude Oil lower as OPEC struggles to cut further.
- OPEC attempts to prop up Crude Oil bids with Declaration of Cooperation.

West Texas Intermediate (WTI) US Crude Oil backslid on Thursday despite a decline in Crude Oil supplies, with gasoline reserves surging higher according to data from the Energy Information Administration (EIA).
Crude Oil rose on Wednesday as Iranian-backed Houthi rebels continue to attack ships in the key logistic waterways around Yemen, and energy investors continue to get rattled by the potential for supply disruptions between Europe and Asia as ships initially bound for the Suez Canal got diverted around the continent of Africa, adding significant sailing time to already-shipped goods.
The reality of global Crude Oil supply continues to snub market fears of hypothetical supply crimps as US refined gasoline supplies burgeon. The EIA reported that US Crude Oil reserves declined 5.5 million barrels for the week ended December 29, more than the forecast 3.7215 million barrel decline, and adding to the previous week’s 7.114 million barrel drawdown. Despite the drag on US barrel counts, EIA refined gasoline reserves surged by nearly 11 million barrels, where the market was expecting a 1.67 million barrel decline compared to the previous 6769K drawdown.
A massive buildup of gasoline products leaves Crude Oil on the low side as global production of fossil fuel products continues to stuff supply pipelines, capping off forward-looking purchasing expectations.
The Organization of the Petroleum Exporting Countries (OPEC) released a statement alongside non-OPEC Declaration of Cooperation (DoC) countries, meant to bolster near-term barrel bids as OPEC reaffirms their dedication to ‘market stability’, a common OPEC dog-whistle for attempting to drastically undersupply global oil markets. With global oil demand continuing to slump and reserves build up faster than anticipated, investors are increasingly skeptical that OPEC will be able to convince more of its member states that they stand to benefit from decreasing oil production even further, with Crude Oil sales balancing many government budgets from within the cartel itself.
WTI Technical Outlook
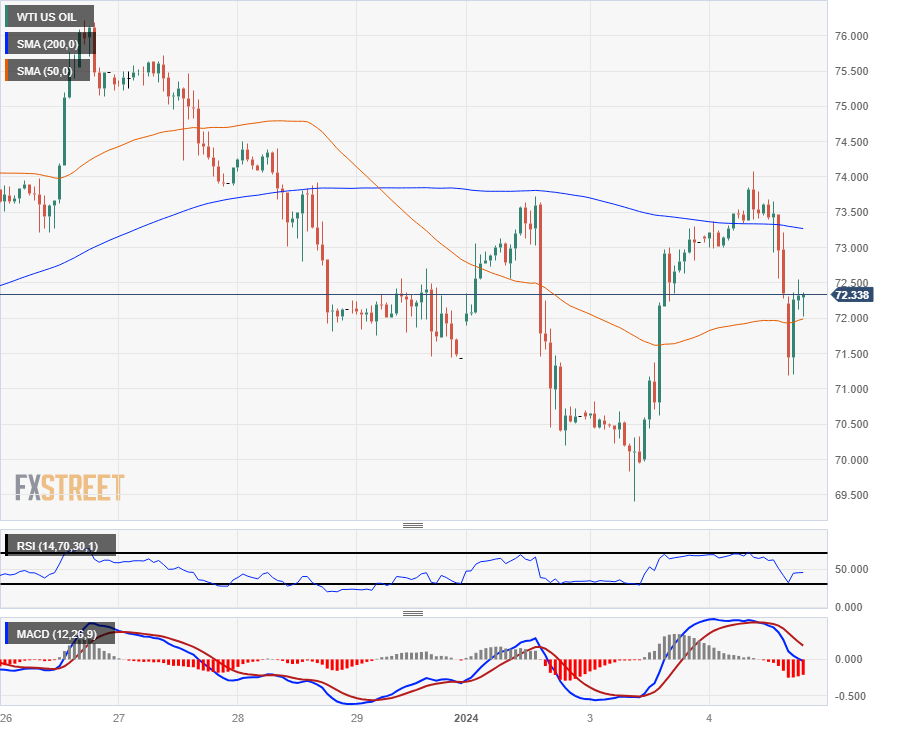
Wednesday’s rebound from $69.50 saw US Crude Oil climb to retest $74.00 per barrel before tumbling back below the $72.00 handle, and WTI is struggling to develop momentum from the $72.50 region.
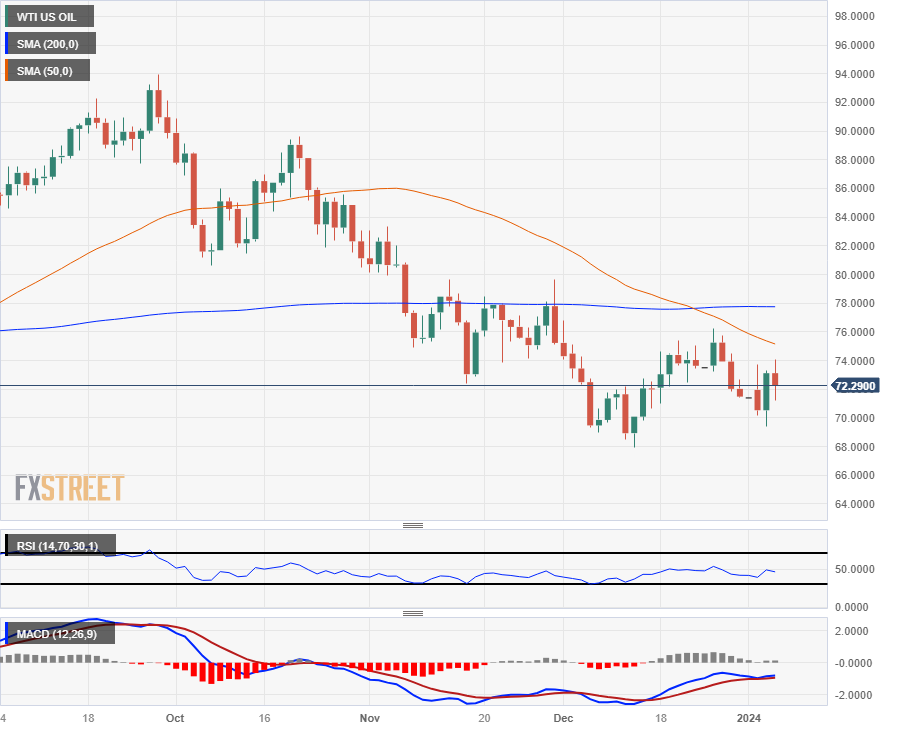
WTI remains on the low side of the 200-day Simple Moving Average (SMA) near the 78.00 handle, and despite finding a technical floor at $68.00 in mid-December, WTI US Crude Oil remains down over 23% from August’s peak bids near $94.00 per barrel.
WTI Hourly Chart
WTI Daily Chart
WTI Technical Levels
Author

Joshua Gibson
FXStreet
Joshua joins the FXStreet team as an Economics and Finance double major from Vancouver Island University with twelve years' experience as an independent trader focusing on technical analysis.


