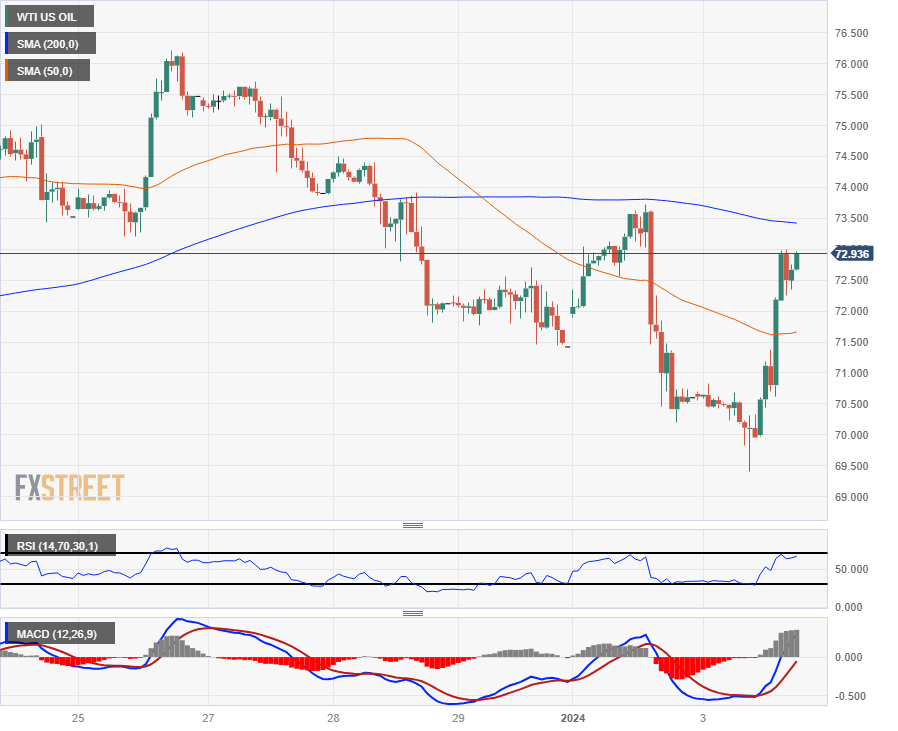
- WTI climbed back into $73 per barrel, recovering ground from early week declines.
- OPEC is set for further supply drawdowns in the face of renewed oversupply.
- USD Crude Oil slumped to a two-week low of $69.50 before rallying 5%.
Further gains are on the cards for West Texas Intermediate (WTI) US Crude Oil after a recovery rally on Wednesday propped up barrel bids to retest the $73.00 handle as the Organization of the Petroleum Exporting Countries (OPEC) is set to bring about further production cuts in an effort to bolster flagging Crude Oil prices.
OPEC pumped an average of 28.05 barrels per day through December according to survey reporting by Bloomberg, and OPEC is expected to pursue an additional 900K bpd in production cuts, but energy markets remain unsure whether or not OPEC production caps will be enough to stave off Crude Oil oversupply from the US and other non-OPEC rivals.
Crude Oil continues to whipsaw amidst shaky production cuts
Many member nations of the 22-country OPEC+ extended alliance are already stretched to their breaking point on the amount of production cuts their government budgets can shoulder, and with OPEC lacking any mechanisms to reinforce production quotas or to punish members that flout production limits, Crude Oil traders remain concerned that production will continue to outpace slumping global crude demand.
OPEC+ will be holding a monitoring meeting to review activities in Crude Oil markets on February 1, to be followed up by a meeting of OPEC+ ministers in early June. Confidence in OPEC's ability to provide benefits for all members came under scrutiny recently after member nation Angola left the oil cartel in favor of pursuing uncapped Crude Oil production.
Crude Oil continues to catch support in the near term from Federal Reserve (Fed) rate cut expectations, and an overly dovish/hawkish showing from the Fed’s latest meeting minutes due later on Thursday could further bolster barrel bids, or send Crude Oil back down again as investors readjust expectations following the Fed’s latest meeting update.
WTI Technical Outlook
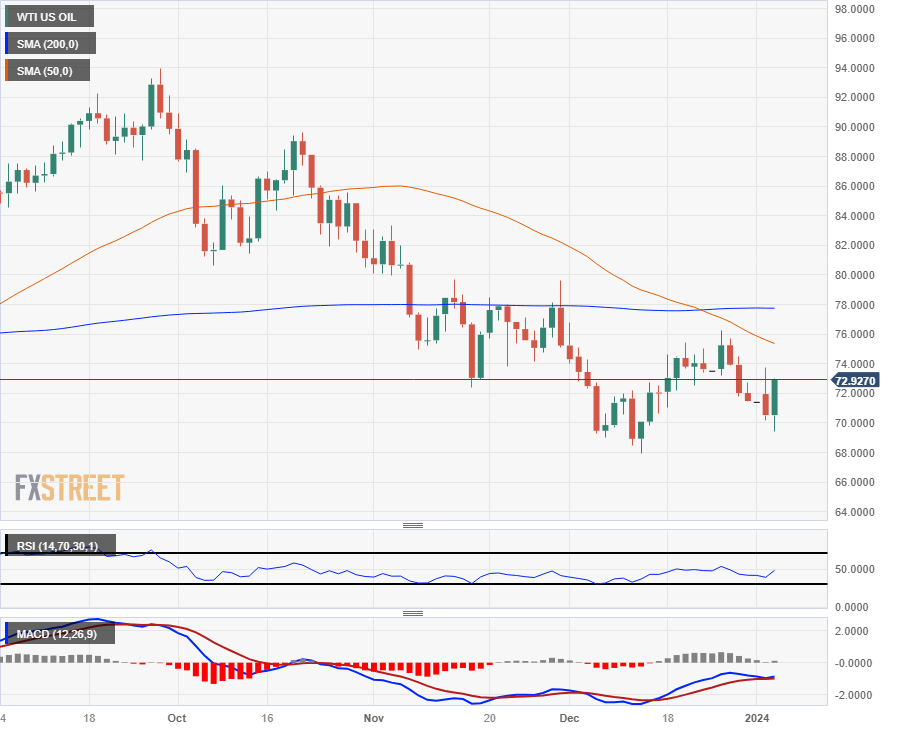
Wednesday’s rebound in WTI further highlights just how far Crude Oil has fallen; WTI remains down an eye-watering 22% from September’s peak of $93.98. Daily candlesticks remain below the 200-day Simple Moving Average (SMA) at $78.00, and a bearish cross of the 50-day SMA has baked in a technical ceiling near $76.00.
Intraday action remains capped below the 200-hour SMA near $73.50, and a bullish break to the topside will see additional technical resistance from last week’s peak near the $76.00 handle.
WTI Hourly Chart
WTI Daily Chart
WTI Technical Levels
Information on these pages contains forward-looking statements that involve risks and uncertainties. Markets and instruments profiled on this page are for informational purposes only and should not in any way come across as a recommendation to buy or sell in these assets. You should do your own thorough research before making any investment decisions. FXStreet does not in any way guarantee that this information is free from mistakes, errors, or material misstatements. It also does not guarantee that this information is of a timely nature. Investing in Open Markets involves a great deal of risk, including the loss of all or a portion of your investment, as well as emotional distress. All risks, losses and costs associated with investing, including total loss of principal, are your responsibility. The views and opinions expressed in this article are those of the authors and do not necessarily reflect the official policy or position of FXStreet nor its advertisers. The author will not be held responsible for information that is found at the end of links posted on this page.
If not otherwise explicitly mentioned in the body of the article, at the time of writing, the author has no position in any stock mentioned in this article and no business relationship with any company mentioned. The author has not received compensation for writing this article, other than from FXStreet.
FXStreet and the author do not provide personalized recommendations. The author makes no representations as to the accuracy, completeness, or suitability of this information. FXStreet and the author will not be liable for any errors, omissions or any losses, injuries or damages arising from this information and its display or use. Errors and omissions excepted.
The author and FXStreet are not registered investment advisors and nothing in this article is intended to be investment advice.
Recommended content
Editors’ Picks
EUR/USD clings to gains above 1.0750 after US data
EUR/USD manages to hold in positive territory above 1.0750 despite retreating from the fresh multi-week high it set above 1.0800 earlier in the day. The US Dollar struggles to find demand following the weaker-than-expected NFP data.
GBP/USD declines below 1.2550 following NFP-inspired upsurge
GBP/USD struggles to preserve its bullish momentum and trades below 1.2550 in the American session. Earlier in the day, the disappointing April jobs report from the US triggered a USD selloff and allowed the pair to reach multi-week highs above 1.2600.
Gold struggles to hold above $2,300 despite falling US yields
Gold stays on the back foot below $2,300 in the American session on Friday. The benchmark 10-year US Treasury bond yield stays in negative territory below 4.6% after weak US data but the improving risk mood doesn't allow XAU/USD to gain traction.
Bitcoin Weekly Forecast: Should you buy BTC here? Premium
Bitcoin (BTC) price shows signs of a potential reversal but lacks confirmation, which has divided the investor community into two – those who are buying the dips and those who are expecting a further correction.
Week ahead – BoE and RBA decisions headline a calm week
Bank of England meets on Thursday, unlikely to signal rate cuts. Reserve Bank of Australia could maintain a higher-for-longer stance. Elsewhere, Bank of Japan releases summary of opinions.