|

WTI climbs on geopolitical tension amid supply disruptions concerns

  • WTI Crude Oil, the US benchmark, rises over 2% amid escalating geopolitical tensions in the Middle East.
  • Attacks on ships around the Red Sea by a militant group linked to Iran, impacting Oil shipping routes, contribute to the rally.
  • The recent weakening of the US Dollar after the Federal Reserve pivot, along with geopolitical risks, to underpin WTI’s price.

The US Crude Oil benchmark, also known as West Texas Intermediate (WTI), has risen more than 2% on geopolitical risks as a militant group linked to Iran continues to attack ships around the Red Sea. This has triggered a rally in WTI, exchanging hands at $73.82 due to Oil supply disruption.

WTI surges as a militant group linked to Iran continues attacks on ships in the Red Sea

Crude Oil prices extended their rally to four straight days, bolstered by a weaker US Dollar (USD) after the US Federal Reserve (Fed) ended its tightening cycle, hinting that rate cuts lie ahead in 2024. Nevertheless, an attack on Norwegian-owned vessels and Oil shipping firms avoiding the Red Sea is already impacting Oil prices.

Sources cited by Reuters said, “The rise in geopolitical risk premium, which has come in the form of regular hostilities towards commercial vessels in the Red Sea by Iran-backed Houthi rebels, plays its indisputable part in Oil's resurrection.”

Around 15% of world shipping traffic passes via the Suez Canal, the shortest shipping route between Europe and Asia.

Meanwhile, an increase in supply cushioned WTI’s rise on Monday, but Russia and Saudi Arabia, extending Crude Oil production cuts to the first quarter of 2024, are underpinning Oil prices.

WTI’s outlook remains uncertain due to the recent developments, but due to the location of daily moving averages (DMAs) above WTi’s price, could open the door for further losses. Otherwise, further escalation in the Middle East area, could lift prices and dent inflation progress worldwide.

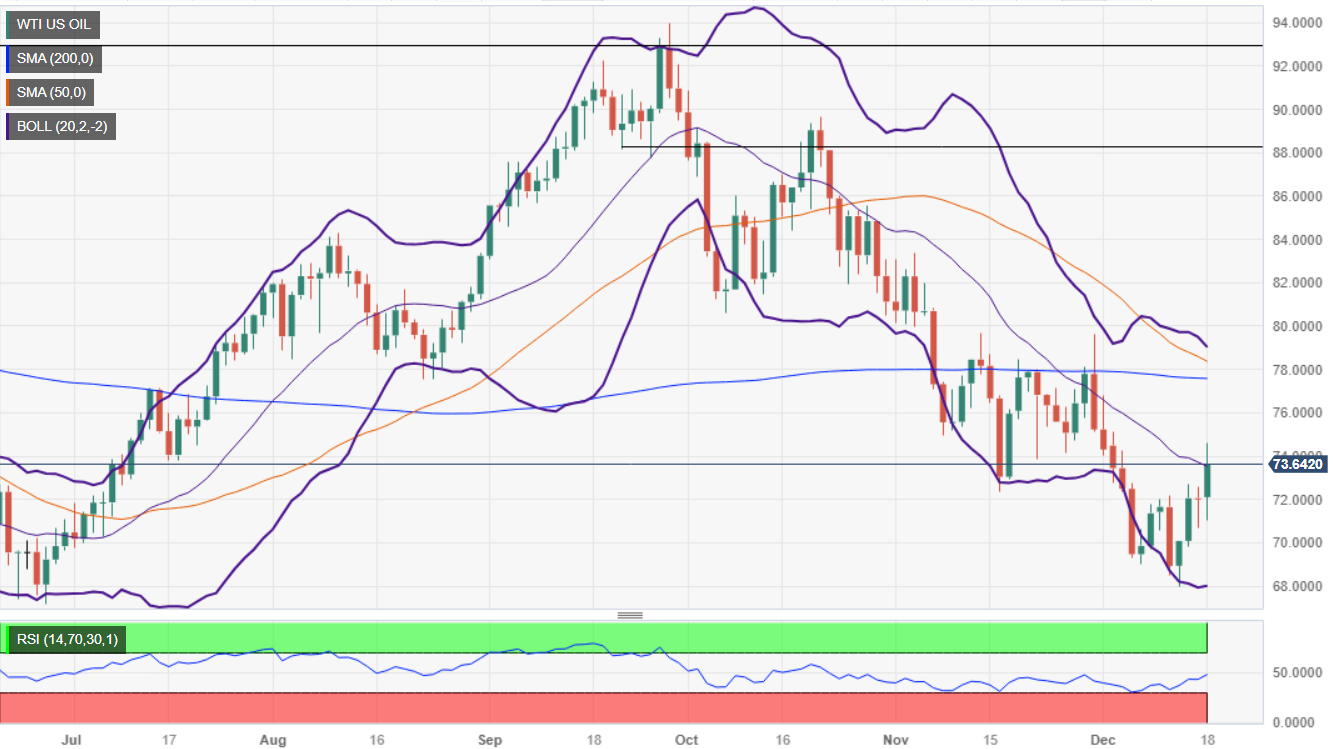
WTI Price Analysis: Technical outlook

The daily chart portrays WTI as neutral to downward biased, but today’s jump would pave the way for a new trading range within the $72.22-$76.00 area, ahead of testing the 200-day moving average (DMA) at $77.72.  On the other hand, achieving a daily close below November’s 16 latest cycle low of $72.22 could open the door to a dip to the $70.00 mark, followed by December’s swing low of $67.74.

WTI US OIL

Overview
Today last price73.72
Today Daily Change1.71
Today Daily Change %2.37
Today daily open72.01
 
Trends
Daily SMA2073.72
Daily SMA5078.6
Daily SMA10081.62
Daily SMA20077.6
 
Levels
Previous Daily High72.56
Previous Daily Low70.66
Previous Weekly High72.73
Previous Weekly Low67.97
Previous Monthly High83.34
Previous Monthly Low72.39
Daily Fibonacci 38.2%71.39
Daily Fibonacci 61.8%71.83
Daily Pivot Point S170.92
Daily Pivot Point S269.84
Daily Pivot Point S369.02
Daily Pivot Point R172.83
Daily Pivot Point R273.65
Daily Pivot Point R374.73

Author

Christian Borjon Valencia

Christian Borjon began his career as a retail trader in 2010, mainly focused on technical analysis and strategies around it. He started as a swing trader, as he used to work in another industry unrelated to the financial markets.

More from Christian Borjon Valencia
Share:

Markets move fast. We move first.

Orange Juice Newsletter brings you expert driven insights - not headlines. Every day on your inbox.

By subscribing you agree to our Terms and conditions.

Editor's Picks

EUR/USD bounces toward 1.1750 as US Dollar loses strength

EUR/USD returned to the 1.1750 price zone in the American session on Friday, despite falling Wall Street, which indicates risk aversion. Trading conditions remain thin following the New Year holiday and ahead of the weekend, with the focus shifting to US employment and European data scheduled for next week.

GBP/USD nears 1.3500, holds within familiar levels

After testing 1.3400 on the last day of 2025, GBP/USD managed to stage a rebound. Nevertheless, the pair finds it difficult to gather momentum and trades with modest intraday gains at around 1.3490 as market participants remain in holiday mood.

Gold trims intraday gains, approaches $4,300

Gold retreated sharply from the $4,400  area and trades flat for the day in the $4,320 price zone. Choppy trading conditions exacerbated the intraday decline, although XAU/USD bearish case is out of the picture, considering growing expectations for a dovish Fed and persistent geopolitical tensions.

Cardano gains early New Year momentum, bulls target falling wedge breakout

Cardano kicks off the New Year on a positive note and is extending gains, trading above $0.36 at the time of writing on Friday. Improving on-chain and derivatives data point to growing bullish interest, while the technical outlook keeps an upside breakout in focus.

Economic outlook 2026-2027 in advanced countries: Solidity test

After a year marked by global economic resilience and ending on a note of optimism, 2026 looks promising and could be a year of solid economic performance. In our baseline scenario, we expect most of the supportive factors at work in 2025 to continue to play a role in 2026.

Crypto market outlook for 2026

Year 2025 was volatile, as crypto often is.  Among positive catalysts were favourable regulatory changes in the U.S., rise of Digital Asset Treasuries (DAT), adoption of AI and tokenization of Real-World-Assets (RWA).