|

WTI climbs but stalls at $79.00 amidst a soft US Dollar after US inflation data

  • WTI got bolstered by a soft US Dollar, though it struggled to break above solid resistance.
  • The deceleration in US Consumer Price Index (CPI) and expectations for a Fed pivot can underpin WTI prices.
  • WTI Price Analysis: Faces a wall of resistance around $79.00.

Western Texas Intermediate (WTI), the US crude oil benchmark, advanced 0.98% on Thursday and extended its gains to two consecutive days, though it is clashing around technical indicators after releasing crucial US inflation data. At the time of writing, WTI is trading at around $78.40 per barrel.

The US Consumer Price Index (CPI) for December dipped 0.1%, as reported by the Department of Labor (DoL), suggesting that the US Federal Reserve (Fed) could slow down the pace of rate increases, a headwind for the greenback. Therefore, oil prices increased, as a weaker US Dollar would benefit crude buyers.

Another factor that bolstered WTI is China’s reopening after authorities removed Covid-19 zero-tolerance policies.

Sources cited by Reuters commented that a soft landing in the US and maybe worldwide, combined with China’s economic rebound, could make for a much better year than feared by most street analysts. Hence, oil demand could rise, and WTI prices would remain elevated unless the output is increased.

Oil traders are also bracing for an additional curb on Russian oil supply, as sanctions over its invasion of Ukraine are pending to begin. The EU ban on importing petroleum products from Russia will start on February 5, and according to the US EIA office, “it could be more disruptive than the EU ban on importing crude oil from Russia.”

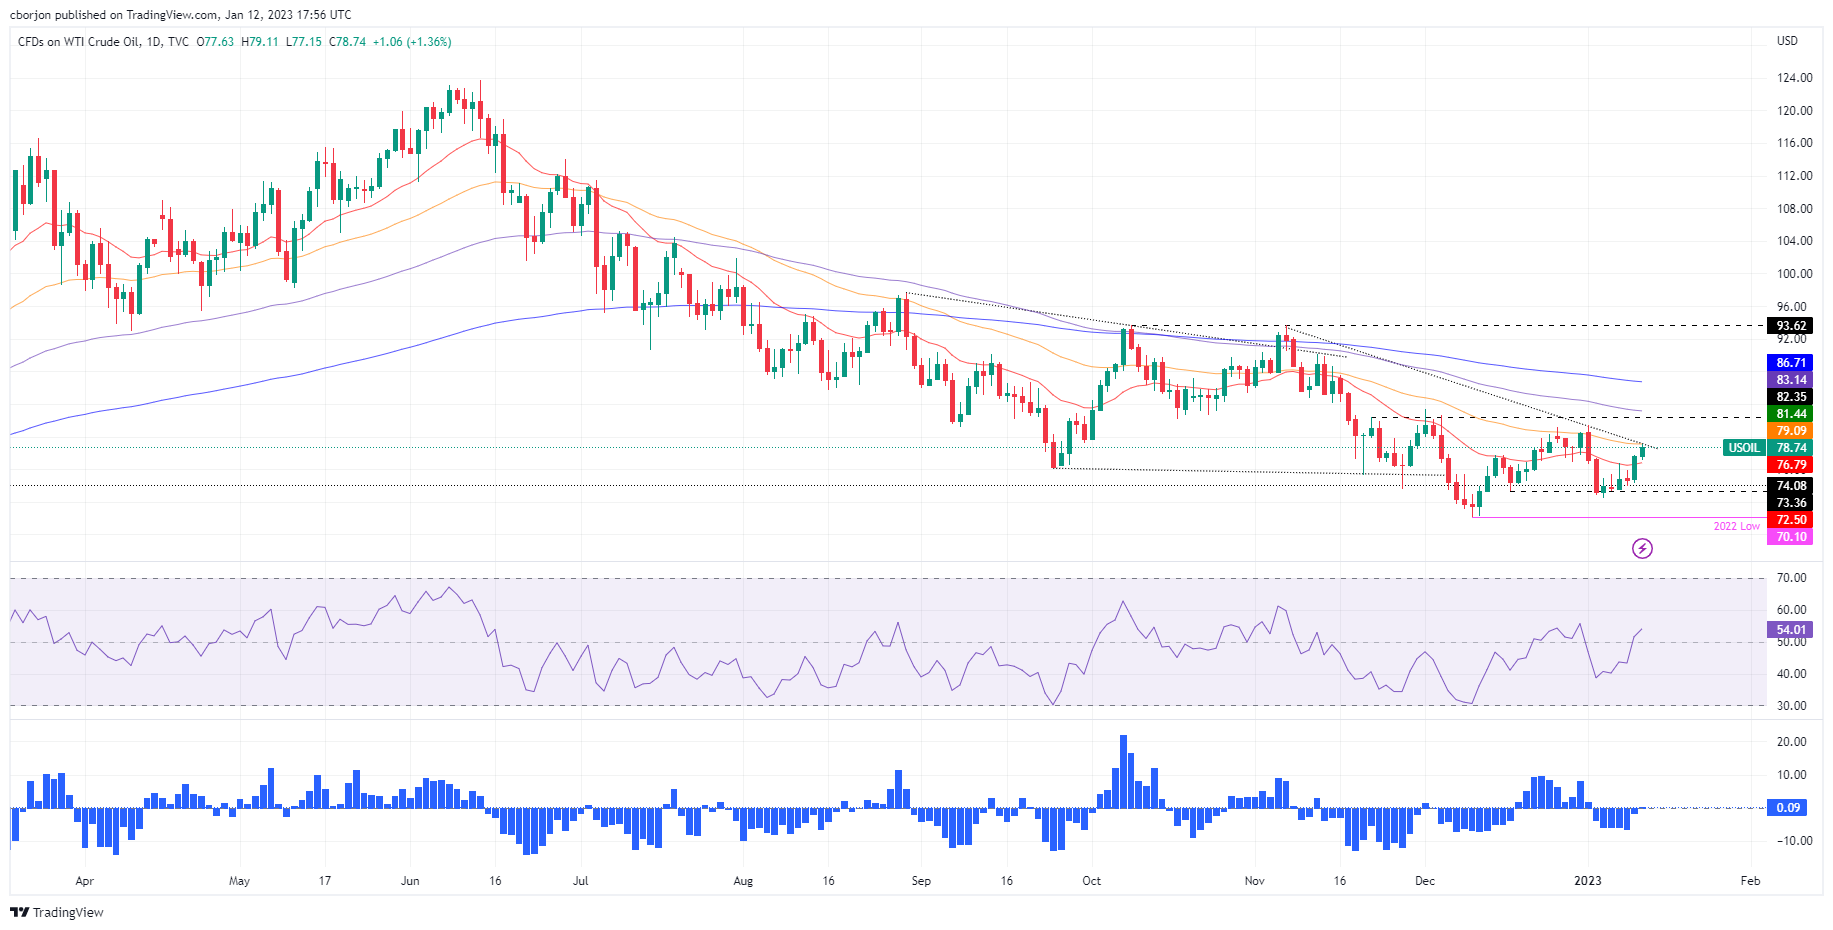
WTI Price Analysis: Technical outlook

From a daily chart perspective, WTI is neutral to downward biased, albeit extending its gains to almost $4 in the last couple of days. WTI’s inability to crack the confluence of a two-month-old downslope trendline and the 50-day Exponential Moving Average (EMA) around $79.00 could exacerbate a retracement, at least to the 20-day EMA at $76.79. However, if WTI breaks above the former, it can rally toward $80.00. On the flip side, once it clears $78.00, that could pave the way toward the $76.00 figure.

WTI US OIL

Overview
Today last price79.03
Today Daily Change1.22
Today Daily Change %1.57
Today daily open77.81
 
Trends
Daily SMA2077.15
Daily SMA5079.26
Daily SMA10082.58
Daily SMA20092.64
 
Levels
Previous Daily High78
Previous Daily Low74.52
Previous Weekly High81.56
Previous Weekly Low72.64
Previous Monthly High83.3
Previous Monthly Low70.27
Daily Fibonacci 38.2%76.67
Daily Fibonacci 61.8%75.85
Daily Pivot Point S175.55
Daily Pivot Point S273.29
Daily Pivot Point S372.07
Daily Pivot Point R179.03
Daily Pivot Point R280.26
Daily Pivot Point R382.51

Author

Christian Borjon Valencia

Christian Borjon began his career as a retail trader in 2010, mainly focused on technical analysis and strategies around it. He started as a swing trader, as he used to work in another industry unrelated to the financial markets.

More from Christian Borjon Valencia
Share:

Markets move fast. We move first.

Orange Juice Newsletter brings you expert driven insights - not headlines. Every day on your inbox.

By subscribing you agree to our Terms and conditions.

Editor's Picks

EUR/USD could test 1.1750 amid strengthening bullish bias

EUR/USD remains flat after two days of small losses, trading around 1.1740 during the Asian hours on Thursday. On the daily chart, technical analysis indicates a strengthening of a bullish bias, as the pair continues to trade within an ascending channel pattern.

GBP/USD consolidates above mid-1.3300s as traders await BoE and US CPI report

The GBP/USD pair struggles to capitalize on the overnight bounce from the 1.3310 area, or a one-week low, and oscillates in a narrow band during the Asian session on Thursday. Spot prices currently trade around the 1.3370 region, down less than 0.10% for the day, as traders opt to wait on the sidelines ahead of the key central bank event risk and US consumer inflation data.

Gold awaits weekly trading range breakout ahead of US CPI report

Gold struggles to capitalize on the previous day's move higher back closer to the $4,350 level and trades with a mild negative bias during the Asian session on Thursday. The downtick could be attributed to some profit-taking amid a US Dollar uptick, though it is likely to remain cushioned on the back of a supportive fundamental backdrop. 

Dogecoin breaks key support amid declining investor confidence

Dogecoin trades in the red on Thursday, following a 4% decline on the previous day. The DOGE supply in profit declines as large wallet investors trim their portfolios. Derivatives data shows a surge in bearish positions amid declining retail interest.

Monetary policy: Three central banks, three decisions, the same caution

While the Fed eased its monetary policy on 10 December for the third consecutive FOMC meeting, without making any guarantees about future action, the BoE, the ECB and the BoJ are holding their respective meetings this week. 

Dogecoin Price Forecast: DOGE breaks key support amid declining investor confidence

Dogecoin (DOGE) trades in the red on Thursday, following a 4% decline on the previous day. The DOGE supply in profit declines as large wallet investors trim their portfolios. Derivatives data shows a surge in bearish positions amid declining retail interest.