WMT Elliott Wave technical analysis [Video]
![WMT Elliott Wave technical analysis [Video]](https://editorial.fxstreet.com/images/Markets/Equities/Industries/Pharma/man-looking-microscope_XtraLarge.jpg)
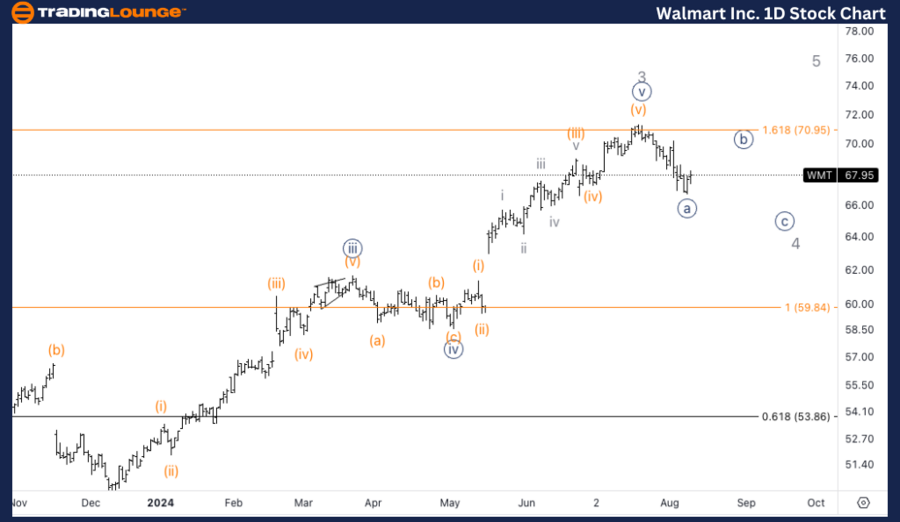
WMT Elliott Wave Analysis Trading Lounge Daily Chart,
Walmart Inc., (WMT) Daily Chart
WMT Elliott Wave technical analysis
Function: Counter Trend.
Mode: Corrective.
Structure: Zigzag.
Position: Minor 4.
Direction: Downside in wave 4.
Details: After topping at 72$, we are looking for further downside into wave 4 to at least reach Medium Level at 65$.
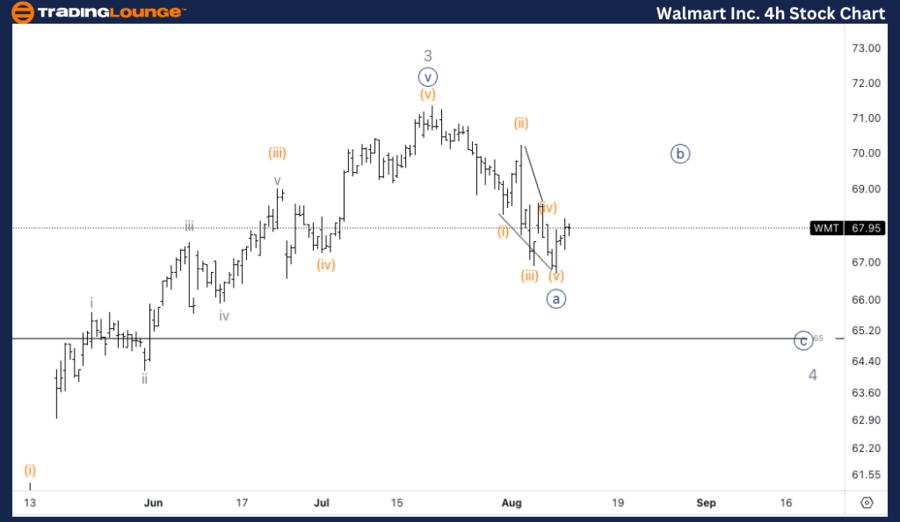
WMT Elliott Wave Analysis Trading Lounge 4H Chart,
Walmart Inc., (WMT) 4H Chart.
WMT Elliott Wave technical analysis
Function: Counter Trend.
Mode: Corrective.
Structure: Zigzag.
Position: Minute wave {a}.
Direction: Bounce in wave {b}.
Details: Looking for a bounce in wave {b} to ideally reach the wave (ii) of the diagonal at around 69$, to then fall back into wave {c}.
Welcome to our latest Elliott Wave analysis for Walmart Inc. (WMT) as of August 12, 2024. This analysis provides an in-depth look at WMT's price movements using the Elliott Wave Theory, helping traders identify potential opportunities based on current trends and market structure. We will cover insights from both the daily and 4-hour charts to offer a comprehensive perspective on WMT's market behavior.
WMT Elliott Wave technical analysis – Daily chart
After topping out at $72, WMT is expected to continue its decline into wave 4. The anticipated downside target for this wave is the Medium Level around $65, where we may find support. Traders should watch for signs of a bottom forming in this area before considering any long positions.
WMT Elliott Wave technical analysis – Four-hour chart
WMT has likely completed wave {a} of the zigzag correction and is now expected to see a bounce in wave {b}. This bounce could ideally reach the area around $69, which corresponds to the wave (ii) of the preceding diagonal. Following this bounce, the price is expected to fall back into wave {c} to complete the overall correction in wave 4.
Technical analyst: Alessio Barretta.
WMT Elliott Wave technical analysis [Video]
Author

Peter Mathers
TradingLounge
Peter Mathers started actively trading in 1982. He began his career at Hoei and Shoin, a Japanese futures trading company.


