Energy Fuels is the largest US miner of uranium. It produces uranium both in form of triuranium octoxide and uranium hexafluoride. Besides the core business, the secondary products of Energy Fuels are rare earth elements and vanadium. Founded in 2006, the company has its headquarters in Lakewood, Colorado. One can trade it under the ticker $UUUU at the New York Stock Exchange. Investors in shares of the mining company are participating, therefore, in the company success story on the one hand and in the price development of the uranium commodity on the other.

Currently, we see the ongoing price appreciation within the energy commodities like oil, gas, coal and others. Consequently, uranium is expected to turn higher after 13 years of weak prices as well. Besides the market correlation in the energy group, the pattern of $UUUU shows a turn higher after 13 years of depressed prices as well. We have discussed the impulsive bullish behavior in the initial article from March 2021. Now, investors in the energy sector obtain a second chance to enter the uranium mining industry while buying a pullback in the largest uranium mining company of US.

Energy fuels weekly Elliott Wave analysis 01.24.2022

Chart

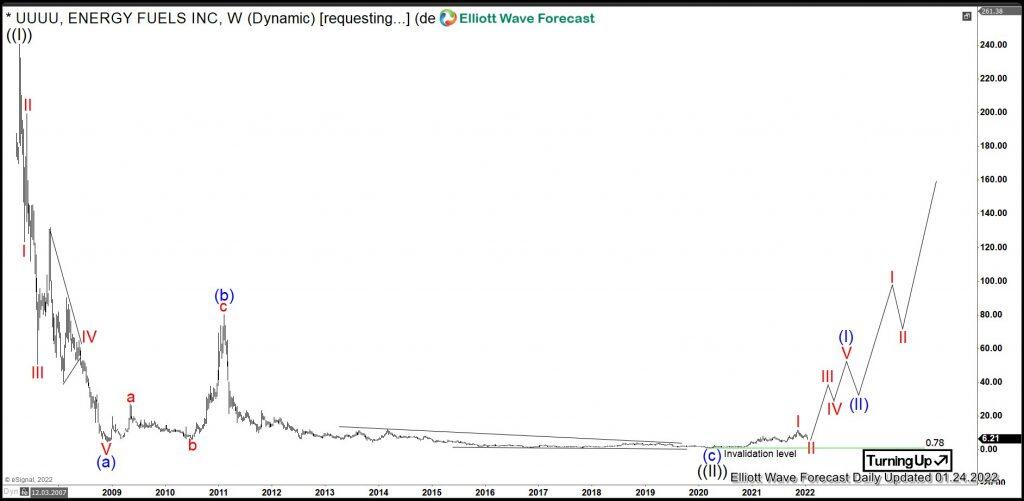
The weekly chart below shows the Energy Fuels shares $UUUU traded at NYSE. First, the stock price has developed a cycle higher in black wave ((I)) of grand super cycle degree. It has printed the all-time highs on April 2007 at 240.61. From the highs, a correction lower in black wave ((II)) has unfolded as an Elliott wave zigzag pattern. It has printed an important bottom on March 2020 at 0.78.

From March 2020 lows, a new cycle in wave ((III)) has already started and should extend towards 240.61 highs and beyond. Then, the target for wave ((III)) will be towards 242.03-391.07 area and even higher.

Energy fuels daily Elliott Wave analysis 01.24.2022

Chart

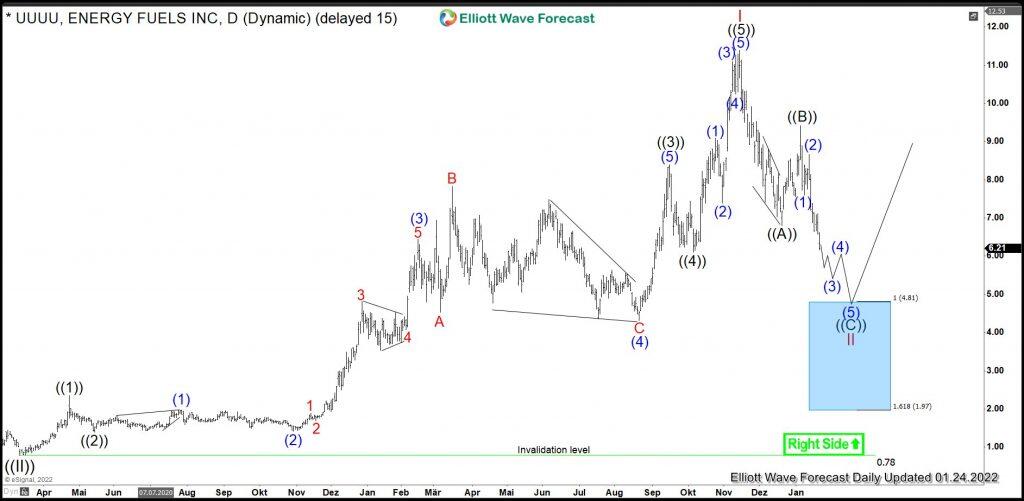
The Daily chart below shows the $UUUU shares price action in more detail. The stock can be in the early stages of the blue wave (I) of the black wave ((III)). First, the cycle higher from March 2020 in red wave I of blue wave (I) has ended in November 2021 at 11.39 highs. From the peak, a correction in wave II is unfolding as a zigzag structure. After ending ((A)) and ((B)), it is currently within wave ((C)). The 3rd leg lower has been confirmed. Now, it can reach towards 4.81-1.97 area. There, buyers can enter the market for a rally in wave III or for a bounce in 3 waves as minimum. The target for wave III of (I) will be towards 11.39 highs and even higher.

Share: Feed news

FURTHER DISCLOSURES AND DISCLAIMER CONCERNING RISK, RESPONSIBILITY AND LIABILITY Trading in the Foreign Exchange market is a challenging opportunity where above average returns are available for educated and experienced investors who are willing to take above average risk. However, before deciding to participate in Foreign Exchange (FX) trading, you should carefully consider your investment objectives, level of xperience and risk appetite. Do not invest or trade capital you cannot afford to lose. EME PROCESSING AND CONSULTING, LLC, THEIR REPRESENTATIVES, AND ANYONE WORKING FOR OR WITHIN WWW.ELLIOTTWAVE- FORECAST.COM is not responsible for any loss from any form of distributed advice, signal, analysis, or content. Again, we fully DISCLOSE to the Subscriber base that the Service as a whole, the individual Parties, Representatives, or owners shall not be liable to any and all Subscribers for any losses or damages as a result of any action taken by the Subscriber from any trade idea or signal posted on the website(s) distributed through any form of social-media, email, the website, and/or any other electronic, written, verbal, or future form of communication . All analysis, trading signals, trading recommendations, all charts, communicated interpretations of the wave counts, and all content from any media form produced by www.Elliottwave-forecast.com and/or the Representatives are solely the opinions and best efforts of the respective author(s). In general Forex instruments are highly leveraged, and traders can lose some or all of their initial margin funds. All content provided by www.Elliottwave-forecast.com is expressed in good faith and is intended to help Subscribers succeed in the marketplace, but it is never guaranteed. There is no “holy grail” to trading or forecasting the market and we are wrong sometimes like everyone else. Please understand and accept the risk involved when making any trading and/or investment decision. UNDERSTAND that all the content we provide is protected through copyright of EME PROCESSING AND CONSULTING, LLC. It is illegal to disseminate in any form of communication any part or all of our proprietary information without specific authorization. UNDERSTAND that you also agree to not allow persons that are not PAID SUBSCRIBERS to view any of the content not released publicly. IF YOU ARE FOUND TO BE IN VIOLATION OF THESE RESTRICTIONS you or your firm (as the Subscriber) will be charged fully with no discount for one year subscription to our Premium Plus Plan at $1,799.88 for EACH person or firm who received any of our content illegally through the respected intermediary’s (Subscriber in violation of terms) channel(s) of communication.

Recommended content


Recommended content

Editors’ Picks

EUR/USD edges lower toward 1.0700 post-US PCE

EUR/USD edges lower toward 1.0700 post-US PCE

EUR/USD stays under modest bearish pressure but manages to hold above 1.0700 in the American session on Friday. The US Dollar (USD) gathers strength against its rivals after the stronger-than-forecast PCE inflation data, not allowing the pair to gain traction.

EUR/USD News

GBP/USD retreats to 1.2500 on renewed USD strength

GBP/USD retreats to 1.2500 on renewed USD strength

GBP/USD lost its traction and turned negative on the day near 1.2500. Following the stronger-than-expected PCE inflation readings from the US, the USD stays resilient and makes it difficult for the pair to gather recovery momentum.

GBP/USD News

Gold struggles to hold above $2,350 following US inflation

Gold struggles to hold above $2,350 following US inflation

Gold turned south and declined toward $2,340, erasing a large portion of its daily gains, as the USD benefited from PCE inflation data. The benchmark 10-year US yield, however, stays in negative territory and helps XAU/USD limit its losses. 

Gold News

Bitcoin Weekly Forecast: BTC’s next breakout could propel it to $80,000 Premium

Bitcoin Weekly Forecast: BTC’s next breakout could propel it to $80,000

Bitcoin’s recent price consolidation could be nearing its end as technical indicators and on-chain metrics suggest a potential upward breakout. However, this move would not be straightforward and could punish impatient investors. 

Read more

Week ahead – Hawkish risk as Fed and NFP on tap, Eurozone data eyed too

Week ahead – Hawkish risk as Fed and NFP on tap, Eurozone data eyed too

Fed meets on Wednesday as US inflation stays elevated. Will Friday’s jobs report bring relief or more angst for the markets? Eurozone flash GDP and CPI numbers in focus for the Euro.

Read more

Forex MAJORS

Cryptocurrencies

Signatures