|

USD/ZAR reverses its course and drops below the 20-day SMA

  • USD/ZAR dropped below the 20-day SMA after peaking at a high near 19.150.
  • South African CPI from September came in higher than expected as well as Retail Sales.
  • Safe haven flows dominate markets, with focus shifting to geopolitics.

At the end of the week, the USD/ZAR trades with mild losses at 19.000, with the ZAR holding its foot driven by hot inflation figures reported on Thursday. On the USD side, it trades soft against its rivals, but a sour market good with investors turning their focus to tensions in the Middle East may reignite the green currency’s momentum.

From September, the Consumer Price Index (CPI) from South Africa came in at 5.4% YoY, higher than the 5.3% expected and the previous 4.8%. In line with that, the ZAR gained momentum as markets is now expecting the South African Reserve Bank (SARB) to maintain its rates higher for a prolonged time as they is targeting inflation to drop in the range between 3% and 6%. On Tuesday, in the October Monetary Policy review, the bank was seen stating that higher oil prices and dry weather conditions were all negatively impacting the inflation outlook. Still, the bank did not hint at additional hikes but confirmed that it will keep rates unchanged at this level for a prolonged period.

On the USD side, it will likely close the week with nearly 0.40% losses, and the green currency faced selling pressure on Thursday after Jerome Powell’s words where he hinted that the higher bond yields will be considered in the next monetary policy decisions. That being said, the US economy is holding strong, and Powell left the door open to another hike in 2023, which could limit the downside for the USD. In addition, growing escalations in the Middle East may fuel safe-haven flows, which would benefit the Greenback, as investors may seek refuge in it.

USD/ZAR Levels to watch 

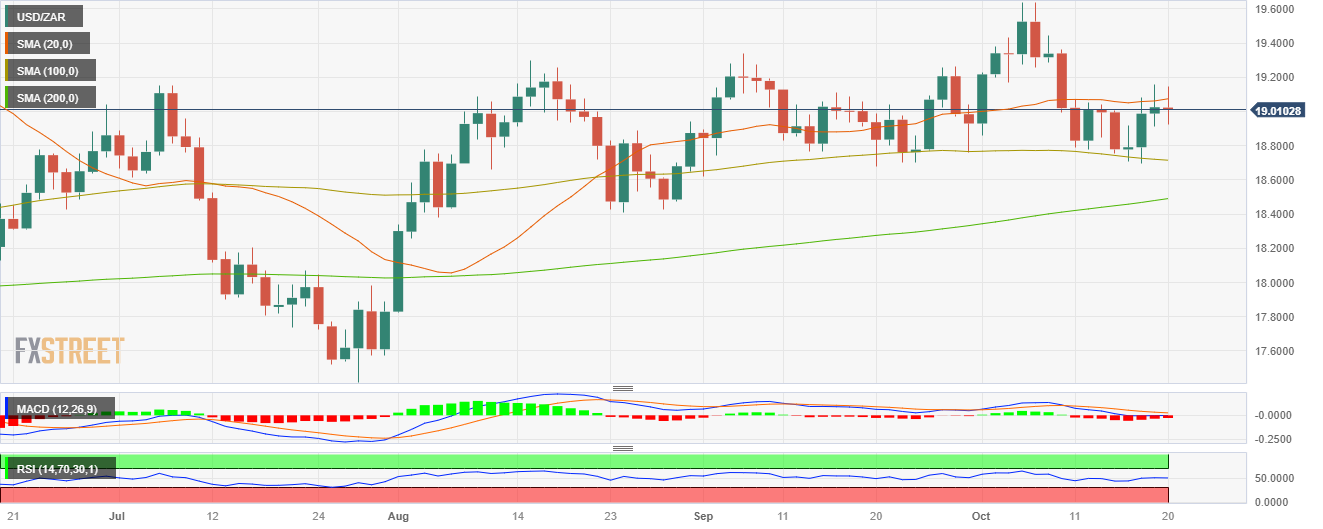
 Analysing the daily chart, a neutral to bearish technical outlook is evident for USD/ZAR, suggesting that the bears are gaining momentum but still do not have an upperhand over the bulls for the short term. The Relative Strength Index (RSI) has turned flat above its midline, while the Moving Average Convergence (MACD) prints flat red bars. Moreover, the pair is below the 20-day Simple Moving Average (SMA) but above the 100 and 200-day SMAs, indicating a favourable position for the bulls in the bigger picture.

 Support levels: 18.905, 18.800, 18.701 (100-day SMA).

 Resistance levels: 19.050 (20-day SMA), 19.157, 19.250.

 USD/ZAR Daily Chart

USD/ZAR

Overview
Today last price19.0081
Today Daily Change-0.0170
Today Daily Change %-0.09
Today daily open19.0251
 
Trends
Daily SMA2019.062
Daily SMA5018.98
Daily SMA10018.7206
Daily SMA20018.4798
 
Levels
Previous Daily High19.1585
Previous Daily Low18.9153
Previous Weekly High19.4432
Previous Weekly Low18.7792
Previous Monthly High19.3366
Previous Monthly Low18.6218
Daily Fibonacci 38.2%19.0656
Daily Fibonacci 61.8%19.0082
Daily Pivot Point S118.9074
Daily Pivot Point S218.7897
Daily Pivot Point S318.6642
Daily Pivot Point R119.1506
Daily Pivot Point R219.2762
Daily Pivot Point R319.3938

Author

Patricio Martín

Patricio is an economist from Argentina passionate about global finance and understanding the daily movements of the markets.

More from Patricio Martín
Share:

Markets move fast. We move first.

Orange Juice Newsletter brings you expert driven insights - not headlines. Every day on your inbox.

By subscribing you agree to our Terms and conditions.

Editor's Picks

EUR/USD climbs toward 1.1800 on broad USD weakness

EUR/USD gathers bullish momentum and advances toward 1.1800 in the second half of the day on Tuesday. The US Dollar weakens and helps the pair stretch higher after the employment report showed that Nonfarm Payrolls declined by 105,000 in October before rising by 64,000 in November.

GBP/USD climbs to fresh two-month high above 1.3400

GBP/USD gains traction in the American session and trades at its highest level since mid-October above 1.3430. The British Pound benefits from upbeat PMI data, while the US Dollar struggles to find demand following the mixed employment figures and weaker-than-forecast PMI prints, allowing the pair to march north.

Gold extends its consolidative phase around $4,300

Gold trades in positive above $4,300 after spending the first half of the day under bearish pressure. XAU/USD capitalizes on renewed USD weakness after the jobs report showed that the Unemployment Rate climbed to 4.6% in November and the PMI data revealed a loss of growth momentum in the private sector in December. 

US Retail Sales virtually unchanged at $732.6 billion in October

Retail Sales in the United States were virtually unchanged at $732.6 billion in October, the US Census Bureau reported on Tuesday. This print followed the 0.1% increase (revised from 0.3%) recorded in September and came in below the market expectation of +0.1%.

Ukraine-Russia in the spotlight once again

Since the start of the week, gold’s price has moved lower, but has yet to erase the gains made last week. In today’s report we intend to focus on the newest round of peace talks between Russia and Ukraine, whilst noting the release of the US Employment data later on day and end our report with an update in regards to the tensions brewing in Venezuela.

BNB Price Forecast: BNB slips below $855 as bearish on-chain signals and momentum indicators turn negative

BNB, formerly known as Binance Coin, continues to trade down around $855 at the time of writing on Tuesday, after a slight decline the previous day. Bearish sentiment further strengthens as BNB’s on-chain and derivatives data show rising retail activity.