USD/TRY drops to fresh 3-day lows in sub-5.7300 levels


  • The pair extends the correction lower to sub-5.7300 area.
  • TRY appreciates to the vicinity of the 200-hour SMA.
  • US-Turkey talks remain in centre stage over S-400 system, F-35 jets

The Turkish Lira is gathering pace for yet another session and pushing USD/TRY back to the 5.7200 region, or fresh 3-day lows.

USD/TRY upside capped near 5.8300

After climbing to fresh weekly lows in the boundaries of 5.8300 the figure on Tuesday, TRY has managed to reclaim some buying interest and dragged spot to the proximity of the key 200-hour SMA just above the 5.7200 milestone.

In the meantime, negotiations between the US and Turkey remain live with the Russian S-400 missile defense system in centre stage along with US made F-35 jets. The recent meeting between Turkey’s Defense Minister H.Akar and his US peer P.Shanahan appear to have met some common ground, allaying at the same time the threats of US sanctions against Ankara.

Further TRY support comes from the broad-based sentiment supporting the riskier assets and the persistent offered bias hitting the buck.

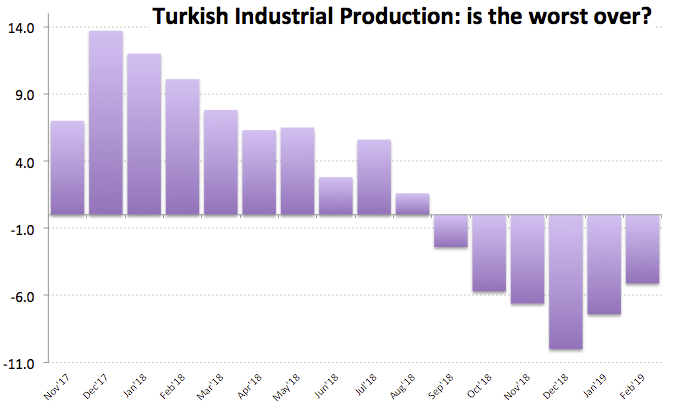
In the domestic docket, it is worth mentioning that Turkish Industrial Production contracted less than expected on a year to February, somewhat adding wings to the Lira.

What to look for around TRY

The Lira is expected to remain under pressure in the near to medium terms, always tracking the performance of the risk-associated complex as well as geopolitical issues including the US, Russia and Syria and political effervescence following the recent municipal elections. In addition, market participants will remain vigilant on the implementation and progress of the structural reforms announced last week, conditio sine qua non for the start of a sustainable economic recovery and a return of the confidence in both the currency and the country.

USD/TRY key levels

At the moment the pair is losing 0.29% at 5.7467 and a break below 5.7217 (200-hour SMA) would aim for 5.7046 (10-day SMA) and then 5.5406 (200-day SMA). On the other hand, the next up barrier lines up at 5.8286 (high Apr.16) seconded by 5.8413 (2019 high Mar.22) and finally 5.8707 (high Oct.23 2018).

Share: Feed news

Information on these pages contains forward-looking statements that involve risks and uncertainties. Markets and instruments profiled on this page are for informational purposes only and should not in any way come across as a recommendation to buy or sell in these assets. You should do your own thorough research before making any investment decisions. FXStreet does not in any way guarantee that this information is free from mistakes, errors, or material misstatements. It also does not guarantee that this information is of a timely nature. Investing in Open Markets involves a great deal of risk, including the loss of all or a portion of your investment, as well as emotional distress. All risks, losses and costs associated with investing, including total loss of principal, are your responsibility. The views and opinions expressed in this article are those of the authors and do not necessarily reflect the official policy or position of FXStreet nor its advertisers. The author will not be held responsible for information that is found at the end of links posted on this page.

If not otherwise explicitly mentioned in the body of the article, at the time of writing, the author has no position in any stock mentioned in this article and no business relationship with any company mentioned. The author has not received compensation for writing this article, other than from FXStreet.

FXStreet and the author do not provide personalized recommendations. The author makes no representations as to the accuracy, completeness, or suitability of this information. FXStreet and the author will not be liable for any errors, omissions or any losses, injuries or damages arising from this information and its display or use. Errors and omissions excepted.

The author and FXStreet are not registered investment advisors and nothing in this article is intended to be investment advice.

Recommended content


Recommended content

Editors’ Picks

EUR/USD edges lower toward 1.0700 post-US PCE

EUR/USD edges lower toward 1.0700 post-US PCE

EUR/USD stays under modest bearish pressure but manages to hold above 1.0700 in the American session on Friday. The US Dollar (USD) gathers strength against its rivals after the stronger-than-forecast PCE inflation data, not allowing the pair to gain traction.

EUR/USD News

GBP/USD retreats to 1.2500 on renewed USD strength

GBP/USD retreats to 1.2500 on renewed USD strength

GBP/USD lost its traction and turned negative on the day near 1.2500. Following the stronger-than-expected PCE inflation readings from the US, the USD stays resilient and makes it difficult for the pair to gather recovery momentum.

GBP/USD News

Gold struggles to hold above $2,350 following US inflation

Gold struggles to hold above $2,350 following US inflation

Gold turned south and declined toward $2,340, erasing a large portion of its daily gains, as the USD benefited from PCE inflation data. The benchmark 10-year US yield, however, stays in negative territory and helps XAU/USD limit its losses. 

Gold News

Bitcoin Weekly Forecast: BTC’s next breakout could propel it to $80,000 Premium

Bitcoin Weekly Forecast: BTC’s next breakout could propel it to $80,000

Bitcoin’s recent price consolidation could be nearing its end as technical indicators and on-chain metrics suggest a potential upward breakout. However, this move would not be straightforward and could punish impatient investors. 

Read more

Week ahead – Hawkish risk as Fed and NFP on tap, Eurozone data eyed too

Week ahead – Hawkish risk as Fed and NFP on tap, Eurozone data eyed too

Fed meets on Wednesday as US inflation stays elevated. Will Friday’s jobs report bring relief or more angst for the markets? Eurozone flash GDP and CPI numbers in focus for the Euro.

Read more

Forex MAJORS

Cryptocurrencies

Signatures