|

USD/THB continues losing ground on soft USD data

  • The USD/THB declined to 36.20 on Thursday with sharp losses seen during the European session.
  • Signs of US economic slowdown are unveiled, as Initial Jobless Claims surpassed expectations and the Philadelphia Fed Manufacturing Survey came in soft.
  • Given the soft US economic data, the likelihood of the Fed cutting sooner rather than later has increased.

The USD/THB pair is trading weaker on Thursday with 0.35% losses at around 36.20. Soft Initial Jobless Claims and a reduction in the Philadelphia Fed Manufacturing Survey following the lower-than-expected Consumer Price Index (CPI) seem to be driving the USD downwards on rising dovish bets on the Federal Reserve (Fed).

The Initial Jobless Claims for the week ending May 3, touched a high of 222K, outdoing forecasts and marking an upward revision of the previous week's figures which stood at 232K. Continued economic softness may mount pressure on the Federal Reserve (Fed), to cut rates earlier. However, markets continue to see the easing starting in September but if data continues to outperform, the Fed might consider a cut in July.

USD/THB technical analysis

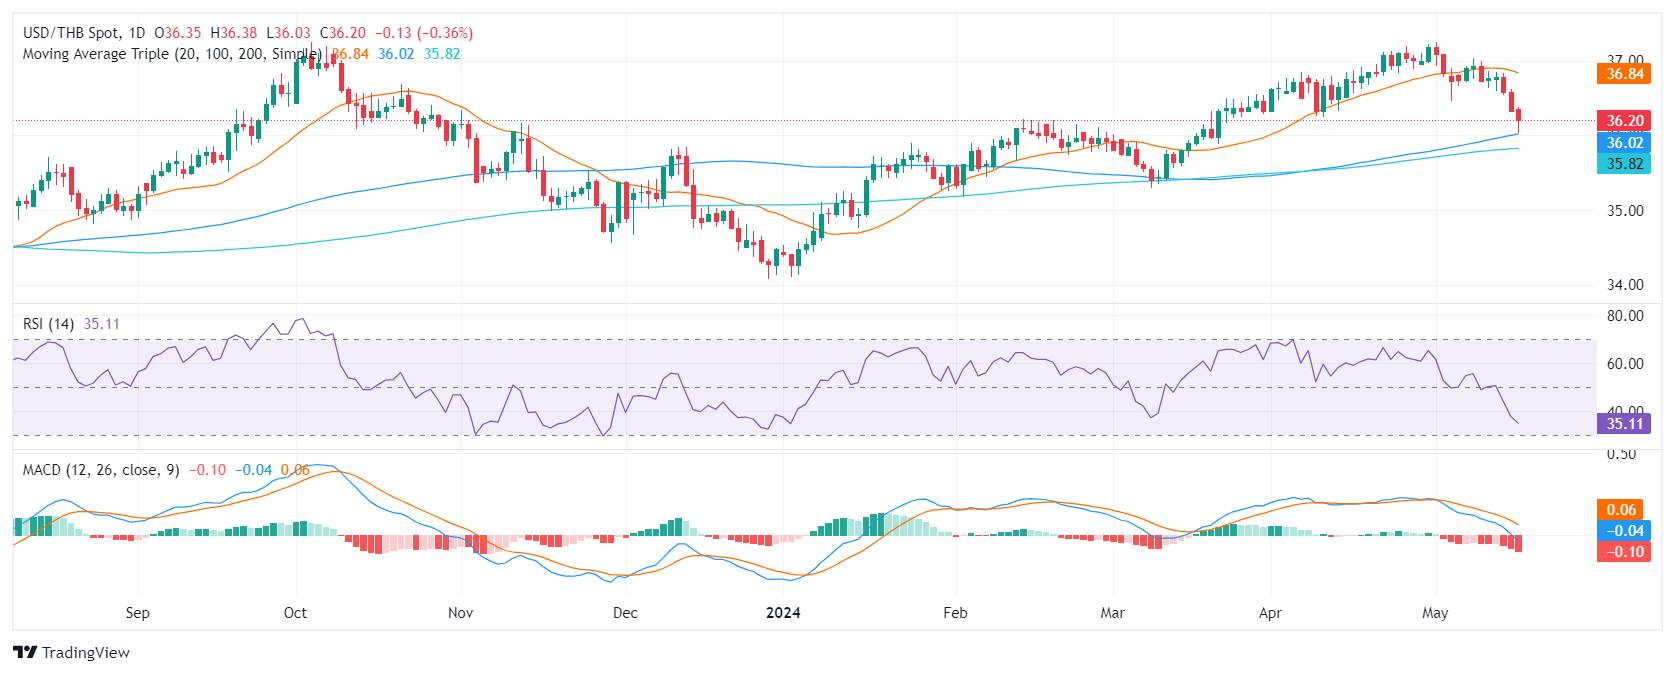
On the daily chart, the Relative Strength Index (RSI) shows a decrease from positive territory to negative in the last session, now nearing oversold conditions. This indicates that sellers currently dominate the market. Concurrently, the Moving Average Convergence Divergence (MACD) histogram details rising red bars, indicative of increasing negative momentum.

The USD/THB pair's position in relation to its Simple Moving Averages (SMAs), shows it positioned below the 20-day but above the 100 and 200-day averages. This suggests that while the short-term outlook is negative, the medium to longer outlook remains positive, as long as buyers defend these levels.

USD/THB daily chart

Author

Patricio Martín

Patricio is an economist from Argentina passionate about global finance and understanding the daily movements of the markets.

More from Patricio Martín
Share:

Markets move fast. We move first.

Orange Juice Newsletter brings you expert driven insights - not headlines. Every day on your inbox.

By subscribing you agree to our Terms and conditions.

Editor's Picks

EUR/USD recovers to 1.1750 region as 2025 draws to a close

Following the bearish action seen in the European session on Wednesday, EUR/USD regains its traction and recovery to the 1.1750 region. Nevertheless, the pair's volatility remains low as trading conditions thin out on the last day of the year.

GBP/USD stays weak near 1.3450 on modest USD recovery

GBP/USD remains under modest beairsh pressure and fluctuates at around 1.3450 on Wednesday. The US Dollar finds fresh demand due to the end-of-the-year position adjustments, weighing on the pair amid the pre-New Year trading lull. 

Gold retreats to $4,300 area, looks to post monthly gains

Gold stays on the back foot on the last day of 2025 and trades near $4,300, possibly pressured by profit-taking and position adjustments. Nevertheless, XAU/USD remains on track to post gains for December and extend its winning streak into a fifth consecutive month.

Bitcoin, Ethereum and XRP prepare for a potential New Year rebound

Bitcoin, Ethereum, and Ripple are holding steady on Wednesday after recording minor gains on the previous day. Technically, Bitcoin could extend gains within a triangle pattern while Ethereum and Ripple face critical overhead resistance. 

Economic outlook 2026-2027 in advanced countries: Solidity test

After a year marked by global economic resilience and ending on a note of optimism, 2026 looks promising and could be a year of solid economic performance. In our baseline scenario, we expect most of the supportive factors at work in 2025 to continue to play a role in 2026.

Crypto market outlook for 2026

Year 2025 was volatile, as crypto often is.  Among positive catalysts were favourable regulatory changes in the U.S., rise of Digital Asset Treasuries (DAT), adoption of AI and tokenization of Real-World-Assets (RWA).