|

USD/SEK rises after weak Swedish data

  • The USD/SEK pair commences the week with mild gains around 10.80.
  • Ahead of the Riksbank decision on Wednesday weak Swedish data pressures down the SEK.
  • Markets adjusted their bets on the Fed after the soft NFP report from the US on Friday.

The USD/SEK pair is currently trading with mild gains to begin the week. Despite the optimism from the Federal Reserve's (Fed) projected robust Q2 growth, there are concerns that softer data might impact the USD negatively which may trigger another adjustment of the market's bets on the easing cycle. On the SEK’s side, soft PMIs seem to be applying downward pressure.

On the data front, Sweden's April services and composite PMIs disappointed, with services registering at 48.1 compared to an anticipated 53.8, and a revised figure of 54.1. This decline contributed to a composite PMI of 49.0, down from a revised 53.0 and marked the lowest level since November. As for now, markets anticipate only a 60% chance of a cut this Wednesday from the Riksbank, although a cut becomes fully priced in for June 27.

On the USD side, following the weak job report released on Friday, the likelihood of a July rate cut has surged to 40% from the previous 25%, and the probability of a rate cut in September is near to be price in, after standing at around 55%. The Greenback’s dynamic will be set by the incoming data as Jerome Powell stated that the bank remains data dependent. With no highlights this week, the pair pace will likely be set by the Riksbank’s tone and the market's response to it.

USD/SEK technical analysis

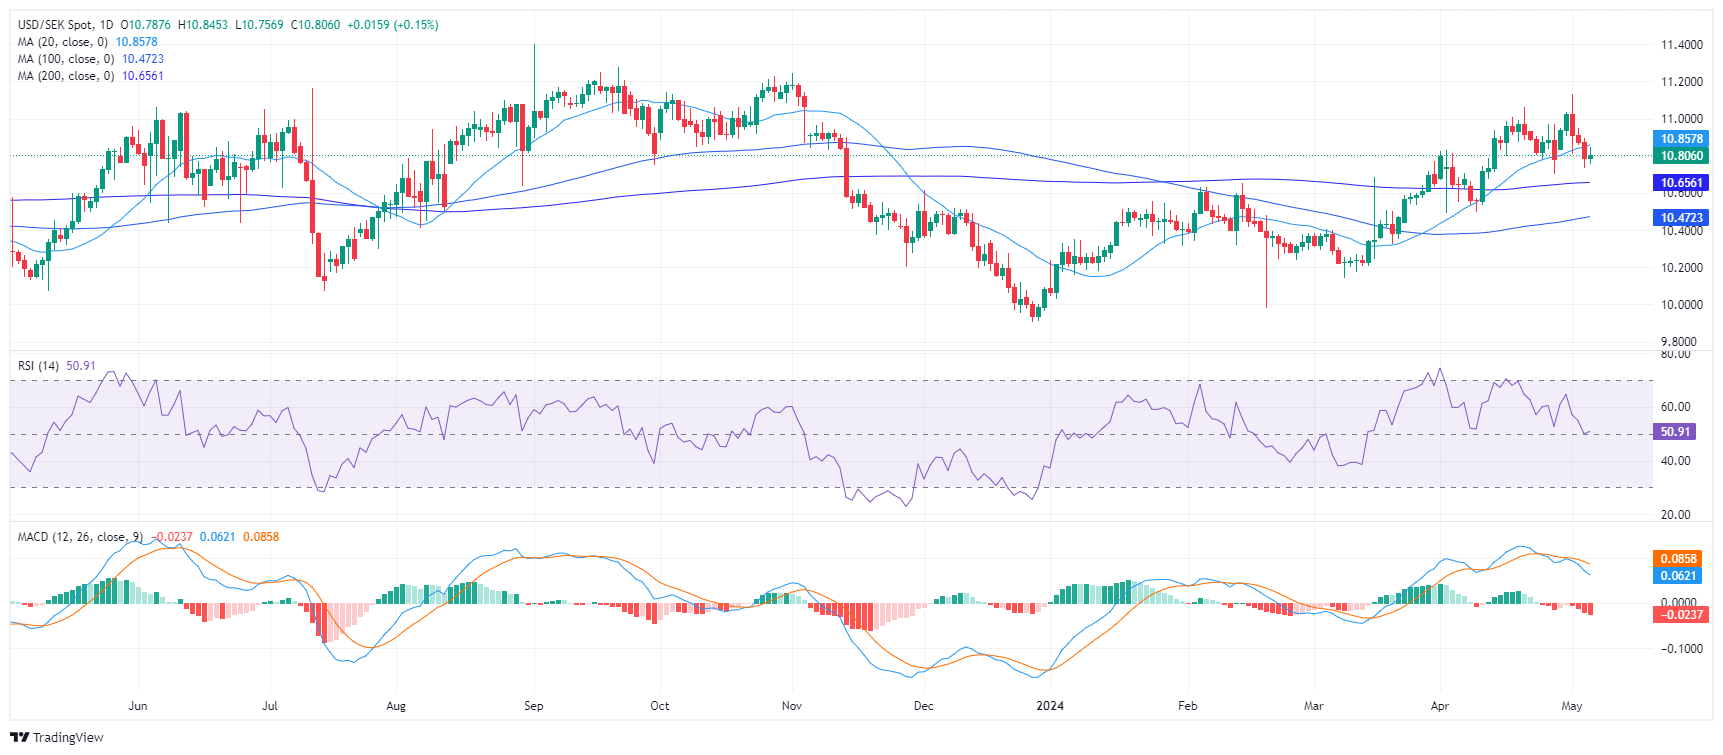
On the daily chart, the Relative Strength Index (RSI) of the USD/SEK pair reveals a transition towards a negative trend falling towards 50. Complementing the RSI effects, the Moving Average Convergence Divergence (MACD) histogram is rising yet printing red bars. This brings to light an increasing negative momentum in the market and a shift of momentum which might start favoring the sellers.

USD/SEK daily chart
USD/SEK

Overview
Today last price10.8067
Today Daily Change0.0166
Today Daily Change %0.15
Today daily open10.7901
 
Trends
Daily SMA2010.8454
Daily SMA5010.6062
Daily SMA10010.4665
Daily SMA20010.6548
 
Levels
Previous Daily High10.8969
Previous Daily Low10.7346
Previous Weekly High11.1318
Previous Weekly Low10.7346
Previous Monthly High11.0627
Previous Monthly Low10.4914
Daily Fibonacci 38.2%10.7966
Daily Fibonacci 61.8%10.8349
Daily Pivot Point S110.7175
Daily Pivot Point S210.645
Daily Pivot Point S310.5553
Daily Pivot Point R110.8798
Daily Pivot Point R210.9695
Daily Pivot Point R311.0421

Author

Patricio Martín

Patricio is an economist from Argentina passionate about global finance and understanding the daily movements of the markets.


More from Patricio Martín
Share:

Editor's Picks

GBP/USD flirts with tops near 1.3470

GBP/USD manages to regain composure and challenge the area of daily highs around 1.3470 on Friday. Cable picks up pace despite marginal gains in the Greenback in a context of swelling geopolitical tensions and rising global oil prices.

EUR/USD struggles above 1.1500 despite USD weakness

EUR/USD struggles with its recovery above 1.1500 in European trading on Monday, despite broad US Dollar weakness and improved risk sentiment. The USD loses traction following US President Trump's call off an attack on Iran and that talks between the two sides would happen on Monday. Traders will closely monitor the developments surrounding US-Iran negotiations and US ISM PMI data.

Gold's struggle with 21-day SMA extends ahead of US-Iran talks

Gold keeps its range around $4,050 early Monday, consolidating the previous decline. The US Dollar holds losses, fuelled by the USD/JPY slump and Mideast diplomacy hopes. Gold awaits a clear directional breakthrough, but sellers likely have the upper hand on the 1D chart.

Week ahead: US payrolls report and AI earnings to keep investors on edge

After the Fed decision, NFP report awaited for more rate hike clues. Employment also on the agenda in Canada and New Zealand. Chinese trade and Japanese wage data to be watched too. But Iran and AI headlines to remain in driver’s seat for risk sentiment.

Solana risks a steeper decline below $70 despite steady ETF inflows

Solana (SOL) is trading in the red, losing bullish momentum and remaining capped below its 50-day Exponential Moving Average at $75.68. SOL-focused Exchange Traded Funds show resilience with a monthly inflow of $14.62 million in July, while the near-term retail support wanes with the funding rate turning negative.

9-3: Is the Federal Reserve’s vote tally Warsh's new forward guidance?
The rate did not move. Neither did the statement, and that’s the more interesting fact. Set the July 29 Federal Open Market Committee (FOMC) statement beside the one issued on June 17, and the two documents are identical apart from a single verb and a paragraph at the bottom naming three dissenters.