|

USD/SEK Price Analysis: Bullish-flag chart pattern in the daily chart targets 9.4000

  • The USD/SEK advances some 0.36% during the day at press time.
  • Thin market liquidity conditions have favored the greenback, which advances against most G8 currencies.
  • USD/SEK Price Forecast: A textbook bullish-flag chart patterns, targets 9.4000.

The USD/SEK advances late in the European session, trading at 9.1256 at the time of writing. On Friday, Wall Street is closed in the US in observance of Christmas; US equity and money markets would re-open on Monday.

Thin market liquidity conditions keep the greenback in the right foot against most G8 majors, except for the British pound, gaining some 0.03%. In the equity markets, most European bourses that opened on Friday are in the green, except for the CAC 40, down some 0.28%.

A recap for US money markets, the US 10-year Treasury yield finished the week at 1.493%, while the US Dollar Index clung to the 96.00 figure, at 96.06, despite losing in the last three trading sessions ahead of Christmas eve.

USD/SEK Price Forecast: Technical outlook

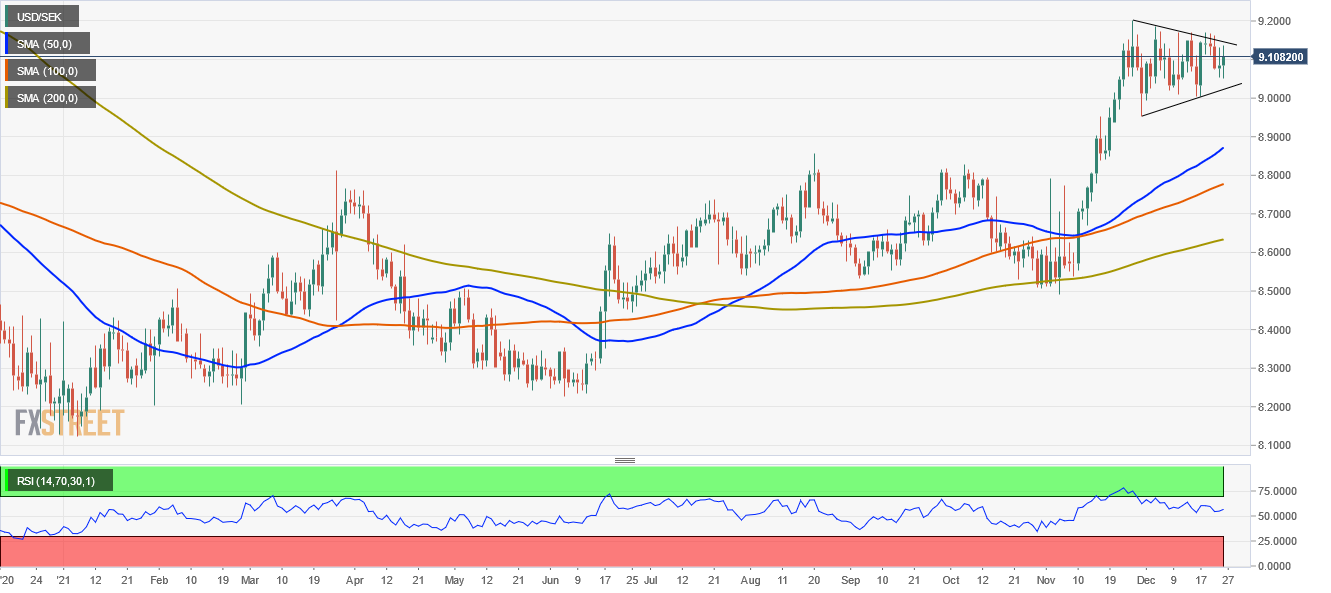
During the Asian and European session, the USD/SEK dipped as low as 9.0500, pierced the December 22 daily low at 9.0535. However, as European traders got to their desks, the pair rallied up to the December 23 daily high around 9.1323, which capped the upward move, settling around current levels.

From the daily chart perspective, the USD/SEK depicts the formation of a “perfect” textbook bullish-flag chart pattern, formed through the month of December, that in the event of breaking around the 9.1500 figure would target 9.4000.

Nevertheless, it would find some hurdles on the way north. The first resistance would be the psychological 9.1500 figure. A breach of the latter would expose successive daily highs/resistance levels reached in December, like the December 20 daily high at 9.1704, followed by the December 3 high at 9.1864, and then the November 26 YTD high at 9.2026.

On the flip side, the first support would be 9.0500. A break below that level would expose the December 16 9.0043, followed by the figure at 9.000.

USD/SEK

Overview
Today last price9.1166
Today Daily Change0.0332
Today Daily Change %0.37
Today daily open9.0834
 
Trends
Daily SMA209.0906
Daily SMA508.8627
Daily SMA1008.773
Daily SMA2008.6312
 
Levels
Previous Daily High9.1325
Previous Daily Low9.0537
Previous Weekly High9.171
Previous Weekly Low9.0044
Previous Monthly High9.2026
Previous Monthly Low8.4916
Daily Fibonacci 38.2%9.1024
Daily Fibonacci 61.8%9.0838
Daily Pivot Point S19.0472
Daily Pivot Point S29.011
Daily Pivot Point S38.9683
Daily Pivot Point R19.126
Daily Pivot Point R29.1687
Daily Pivot Point R39.2048

Author

Christian Borjon Valencia

Markets analyst, news editor, and trading instructor with over 14 years of experience across FX, commodities, US equity indices, and global macro markets.

More from Christian Borjon Valencia
Share:

Editor's Picks

EUR/USD eases marginally, back to 1.1800

EUR/USD navigates a narrow range on Thursday, hovering around the 1.1800 neighbourhood in a context of humble gains in the US Dollar. The pair’s lacklustre performance come amid the unabated trade uncertainty, geopolitical tensions in the Middle East and the cautious tone from the ECB’s Lagarde.

GBP/USD retreats from tops, approaching 1.3540

GBP/USD partially sets aside Wednesday’s strong advance and recedes to the 1.3540 region on Thursday. Cable’s modest retracement follows the equally acceptable gains in the Greenback, while investors continue to pencil in a potential BoE rate cut in March.

Gold clings to gains just below $5,200, focus on geopolitics

Gold is edging modestly higher on Thursday, adding to Wednesday’s uptick and holding just below the $5,200 mark per troy ounce against the backdrop of modest gains in the US Dollar. In the meantime, attention is turning to the geopolitical scenario following US-Iran nuclear talks.

Stellar: Relief bounce fades as bearish undertone persists

Stellar is trading around $0.16 at the time of writing on Thursday after rebounding more than 8% in the previous day. Derivatives data paints a negative picture as XLM’s short bets hit a monthly high while Open Interest continues to decline.

The one thing everyone is on the lookout for is US action of some sort against Iran

The FX market is minestrone soup these days. It is befuddled by conflicting data, rumors and small stories exaggerated out of proportion, and Trump-generated uncertainty. 

Bitcoin steadies as traders eye US–Iran talks

Bitcoin (BTC) price is stabilizing around $68,000 at the time of writing on Thursday after a 6.2% relief rally the previous day amid a broader downward trend.