• The SEK strengthened against the USD after the Riksbank's latest monetary policy decision to cut rates to 3.75%.
  • Officials from the Federal Reserve are expressing wary about cutting rates.
  • The USD traded weak on soft Jobless Claims figures.

The USD/SEK pair is trading lower, indicating bearish momentum for the pair despite the persistence of inflation and robust US economic performance aiding the Dollar's recovery which fuels hawkish bets on the Federal Reserve (Fed). The SEK was seen weak on Wednesday after the Riksbank decided to cut rates to 3.75% and signaled that more cuts may be incoming.

The US Dollar faced downward pressure following the release of disappointing Initial Jobless Claims data. During the week ending May 3, the number of individuals filing for jobless benefits for the first time rose to 231K, surpassing expectations of 210K and the previous reading of 209K, revised up from 208K. This uptick in jobless claims has heightened concerns about weakening conditions in the labor market. That being said, market expectations on the Fed didn’t change, and investors are still seeing the easing cycle starting in September. All eyes will turn to next week’s inflation data from the US which may likely set the tone for the market's expectations on the Fed.

USD/SEK technical analysis

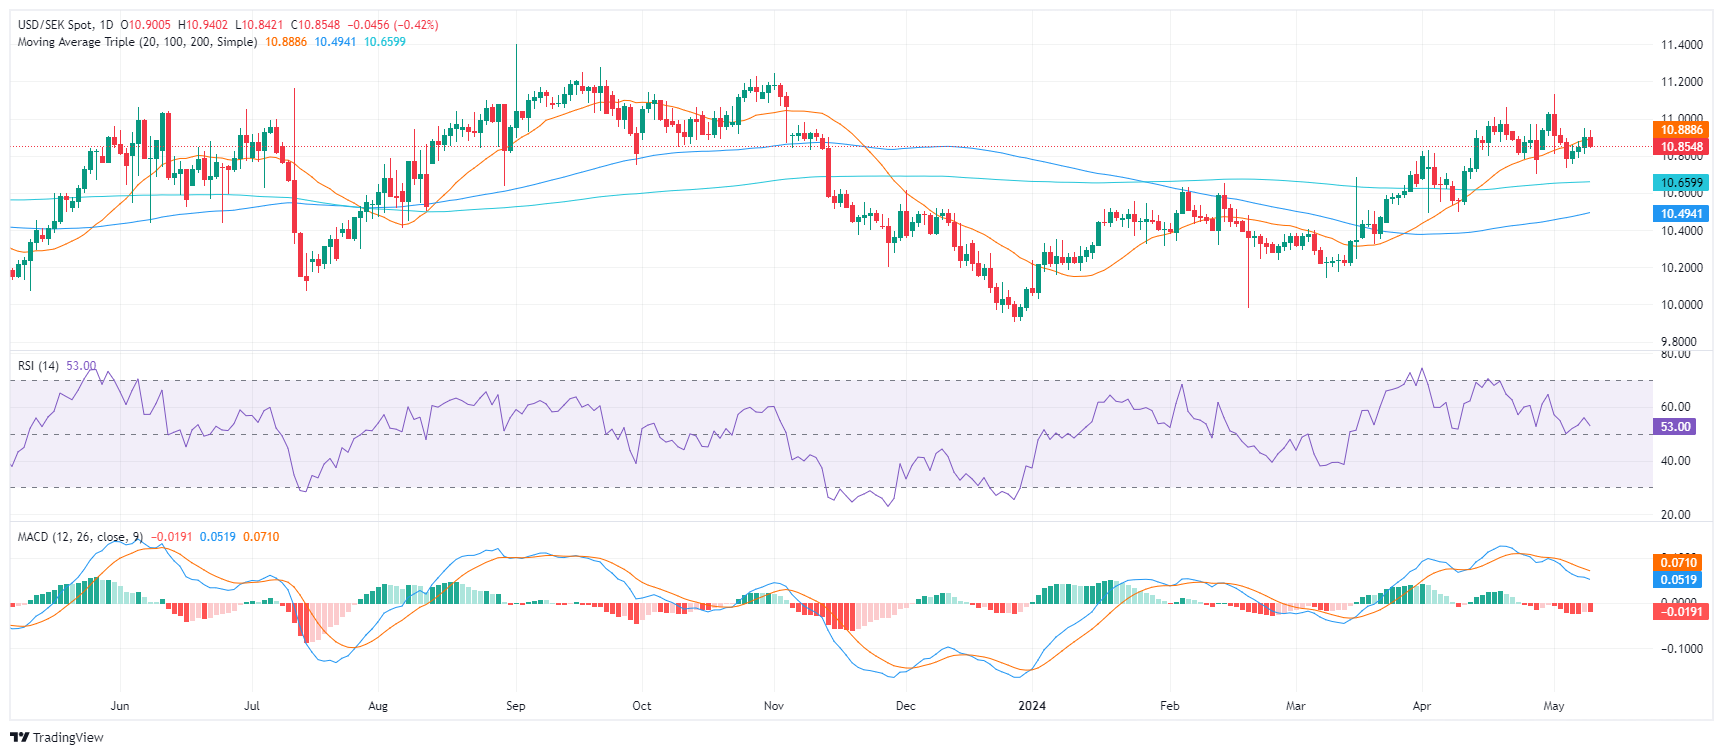
On the daily chart, the Relative Strength Index (RSI) for the USD/SEK reveals a recent move within the positive territory but it points downwards. In addition, the MACD histogram indicates rising red bars, signifying a bearish momentum. The coexistence of the RSI's positive region and the MACD's red bars demonstrates that even though bullish players dominate the market price-wise, the overall trend may be losing steam, hinting at a potential shift in market momentum.

Highlighting the recent movements, the struggle of buyers to uphold the 20-day Simple Moving Average (SMA) at 10.88 may suggest a weak short-term trend. However, the long-term scenario looks strong, considering the pair's position above the 100 and 200-day SMA.

USD/SEK daily chart

USD/SEK

Overview
Today last price 10.8516
Today Daily Change -0.0488
Today Daily Change % -0.45
Today daily open 10.9004
 
Trends
Daily SMA20 10.8827
Daily SMA50 10.6392
Daily SMA100 10.4865
Daily SMA200 10.6586
 
Levels
Previous Daily High 10.9491
Previous Daily Low 10.8066
Previous Weekly High 11.1318
Previous Weekly Low 10.7346
Previous Monthly High 11.0627
Previous Monthly Low 10.4914
Daily Fibonacci 38.2% 10.8947
Daily Fibonacci 61.8% 10.8611
Daily Pivot Point S1 10.8217
Daily Pivot Point S2 10.743
Daily Pivot Point S3 10.6793
Daily Pivot Point R1 10.9641
Daily Pivot Point R2 11.0278
Daily Pivot Point R3 11.1066


Share: Feed news

Information on these pages contains forward-looking statements that involve risks and uncertainties. Markets and instruments profiled on this page are for informational purposes only and should not in any way come across as a recommendation to buy or sell in these assets. You should do your own thorough research before making any investment decisions. FXStreet does not in any way guarantee that this information is free from mistakes, errors, or material misstatements. It also does not guarantee that this information is of a timely nature. Investing in Open Markets involves a great deal of risk, including the loss of all or a portion of your investment, as well as emotional distress. All risks, losses and costs associated with investing, including total loss of principal, are your responsibility. The views and opinions expressed in this article are those of the authors and do not necessarily reflect the official policy or position of FXStreet nor its advertisers. The author will not be held responsible for information that is found at the end of links posted on this page.

If not otherwise explicitly mentioned in the body of the article, at the time of writing, the author has no position in any stock mentioned in this article and no business relationship with any company mentioned. The author has not received compensation for writing this article, other than from FXStreet.

FXStreet and the author do not provide personalized recommendations. The author makes no representations as to the accuracy, completeness, or suitability of this information. FXStreet and the author will not be liable for any errors, omissions or any losses, injuries or damages arising from this information and its display or use. Errors and omissions excepted.

The author and FXStreet are not registered investment advisors and nothing in this article is intended to be investment advice.

Recommended content


Recommended content

Editors’ Picks

EUR/USD extends sideways grind below 1.0900

EUR/USD extends sideways grind below 1.0900

EUR/USD stays in a consolidation phase below 1.0900 following the previous week's rally. In the absence of high-tier data releases, the US Dollar stays resilient against its rivals as investors scrutinize comments from central bank officials. 

EUR/USD News

Gold pulls away from record highs, holds above $2,400

Gold pulls away from record highs, holds above $2,400

Gold rose sharply at the beginning of the week on escalating geopolitical tensions and touched a new all-time high of $2,450. With market mood improving modestly, XAU/USD erases a majority of its daily gains but manages to hold above $2,400.

Gold News

GBP/USD holds steady near 1.2700, Fedspeak in focus

GBP/USD holds steady near 1.2700, Fedspeak in focus

GBP/USD fluctuates in a narrow channel near 1.2700 on the first trading day of the week. The cautious market stance helps the US Dollar hold its ground, while market participants assess remarks from central bank officials ahead of this week's key events.

GBP/USD News

Ripple stays above $0.50 on Monday as firm backs research on blockchain and quantum computing

Ripple stays above $0.50 on Monday as firm backs research on blockchain and quantum computing

XRP price holds steady above the $0.50 key support level and edges higher on Monday, trading at 0.5130 and rising 0.70% in the day at the time of writing.

Read more

Week ahead: Nvidia results and UK CPI falling back to target

Week ahead: Nvidia results and UK CPI falling back to target

What a week for investors. The Dow Jones reached a record high and closed last week above 40,000, for the first time ever. This is a major bullish signal even though gains for global stocks were fairly modest on Friday, and European stocks closed lower. 

Read more

Forex MAJORS

Cryptocurrencies

Signatures