|

USD/SEK declines as US yields lose traction

  • The USD/SEK trimmed daily gains and declined towards 10.900, seeing mild losses.
  • The US government bond yields are falling.
  • Fed expectations and the bond markets will dictate the pace of the session.

The USD/SEK initially rose to a high of 10.9790 on Wednesday and then stabilised around the 10.900 area, with the trajectory of the pair being set by falling US bond yields, which limited the pair’s upside. Other than that, there were no relevant highlights during the session, and the focus is set on next week’s inflation figures from the US from October.

As the economic calendar had nothing relevant to offer on Wednesday,  markets seem to be awaiting fresh stimulus to place their next positions. At the beginning of the week, several Federal Reserve (Fed) were seen pushing back on the dovish narrative, which eventually favoured the rise of the US Dollar and the Treasury yields. Still, investors seem to be awaiting high-tier data, as those will shape the bank's decision next December.

Next week, the US will release Consumer Price Index (CPI) figures from October, which are expected to show a slight deceleration. In that case, markets would likely take of the table the case of a hike in December, which would fuel downward movements on the back of a weakening US Dollar.

In the meantime, the US Treasury 5 and 10-year bond yields are sharply declining, falling towards 4.51%. The 2-year rate stands flat at 4.90%.

USD/SEK Levels to watch 


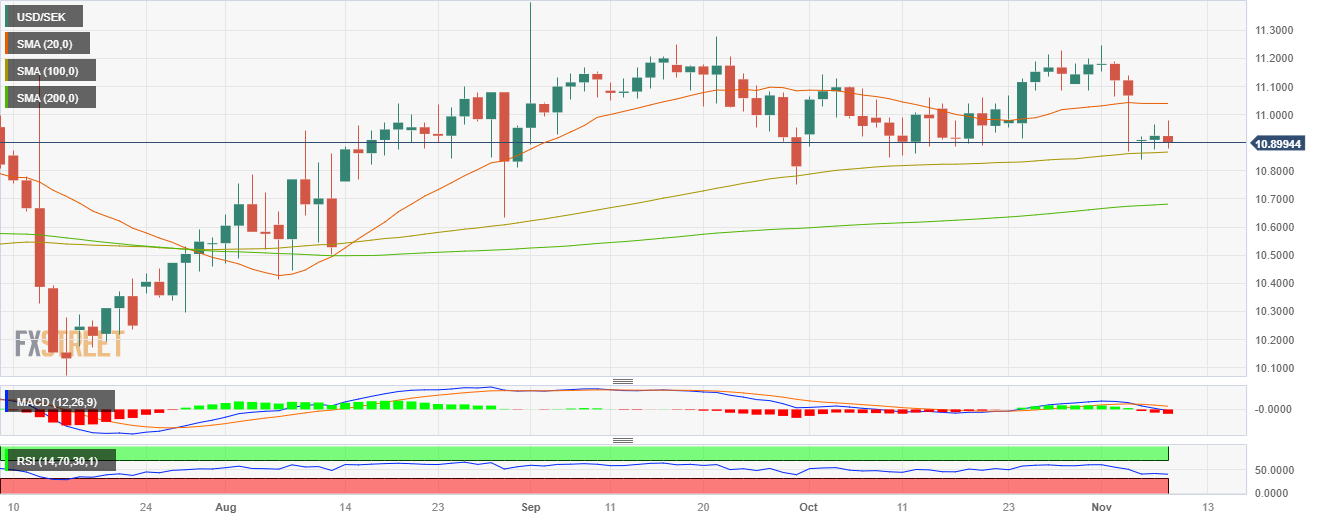
According to the daily chart, the technical outlook for the USD/SEK remains neutral to bearish as the bears are showing signs of recovery. With a flat slope below its midline, the Relative Strength Index (RSI) suggests a period of stability in negative territory, while the Moving Average Convergence (MACD) displays neutral red bars.

On a broader scale, the pair is below the 20-day Simple Moving Average (SMA) but above the 100 and 200-day SMAs, highlighting the continued dominance of bulls. That being said, in case of not recover the 20-day SMA, the pair may see further downside.

Supports: 10.857 (100-day SMA), 10.830, 10.800.
Resistances: 10.9050, 10.950, 11.020 (20-day SMA).

USD/SEK Daily chart

USD/SEK

Overview
Today last price10.9001
Today Daily Change-0.0245
Today Daily Change %-0.22
Today daily open10.9246
 
Trends
Daily SMA2011.04
Daily SMA5011.0483
Daily SMA10010.8648
Daily SMA20010.679
 
Levels
Previous Daily High10.9653
Previous Daily Low10.8772
Previous Weekly High11.2449
Previous Weekly Low10.8692
Previous Monthly High11.2275
Previous Monthly Low10.8482
Daily Fibonacci 38.2%10.9316
Daily Fibonacci 61.8%10.9108
Daily Pivot Point S110.8794
Daily Pivot Point S210.8342
Daily Pivot Point S310.7913
Daily Pivot Point R110.9676
Daily Pivot Point R211.0105
Daily Pivot Point R311.0557

Author

Patricio Martín

Patricio is an economist from Argentina passionate about global finance and understanding the daily movements of the markets.

More from Patricio Martín
Share:

Editor's Picks

AUD/USD bounces off weekly low on Israel-Lebanon ceasefire

AUD/USD recovers slightly from the weekly low during the Asian session on Thursday as a new Israel-Lebanon ceasefire keeps a lid on the safe-haven US Dollar. Meanwhile, the US and Iran remain at odds over key issues, which, along with hawkish Fed expectations, act as a tailwind for the buck. Furthermore, diminishing odds of an RBA rate hike in June cap the currency pair as traders keenly await the US NFP report on Friday.

USD/JPY remains close to 160.00 intervention threshold on Mideast tensions

USD/JPY struggles to find acceptance above 160.00 and retreats from a one-month high during the Asian session on Thursday amid fears that authorities will step in again to prop up the Japanese Yen. Furthermore, a new Israel-Lebanon ceasefire caps the US Dollar and supports the currency pair. However, renewed US-Iran tensions favor the USD bulls amid Fed rate hike bets and also hold back the JPY bulls from placing aggressive bets amid economic risks stemming from the Middle East conflict, suggesting that dips are likely to be bought into.

Gold bounces off one-week low; upside seems capped on Iran uncertainty

Gold recovers from a one-week low touched during the Asian session on Thursday, as news of an Israel-Lebanon ceasefire acts as a headwind for the safe-haven US Dollar. However, renewed hostilities in the Gulf, along with stalled US-Iran peace talks, keep geopolitical risks in play and should support the USD. Moreover, US-Iran tensions remain supportive of higher Crude Oil prices, fueling inflationary concerns and bolstering bets for higher interest rates for longer. This should cap the non-yielding bullion and warrants caution for bulls.


Bitcoin drops below $65K amid reinforced bear market signals

Bitcoin dipped further below $65,000 on Wednesday, with onchain data from Glassnode signaling a market firmly in a bear phase. The decline has pushed prices back into a key valuation range between the Realized Price and the True Market Mean. Glassnode noted that a key shift in market structure has also emerged.

The upside-down math of debt
In 2010, Professors Carmen Reinhart and Kenneth Rogoff published a paper, Growth in a Time of Debt, which instantly went viral. The main thesis of the paper was that once a government's debt-to-GDP ratio crosses above 90%, a financial crisis and default are around the corner.
Recession on paper: What really moves the Canadian Loonie now?

Statistics Canada handed the headline writers a gift and the analysts a headache. Real GDP shrank 0.1% on an annualized basis in the first quarter, and with the fourth quarter of 2025 revised down to a 1.0% contraction, that is two negative quarters in a row, the textbook definition of a technical recession and Canada's first since the pandemic.