|

USD/NOK regains some traction as the US economy holds strong

  • The USD/NOK is presently trading higher at 10.53, marking a 0.32% increase during Friday's session.
  • The US Dollar stands firm as Fed officials show caution due to robust US economic indicators.
  • Investors assess the likelihood of a Fed rate cut in March and May as low due to potential adverse implications on price stability.
  • The USD is anticipated to see gains as the market adjusts its easing expectations and pushes the first rate cut from the Fed to June.

In Friday's trading session, the USD/NOK pair is trading at a level of 10.53, registering a modest gain of 0.32%. The US Dollar (USD) is showing a stable performance in light of Federal Reserve (Fed) officials adopting a cautious stance in light of a strong US economy. As a reaction, the probability of a rate cut in March and May by the Fed appears to be low according to the market’s expectations.

On the other hand, the short term of the NOK will be dictated on whether the Norges Bank will follow the Fed’s stance to delay cuts which will be guided by local data. In addition, the Norwegian currency gained momentum in 2024, due to rising Oil prices, as it is an important global producer, so in case, the black gold advances further the pair’s upside may be limited.

USD/NOK technical analysis

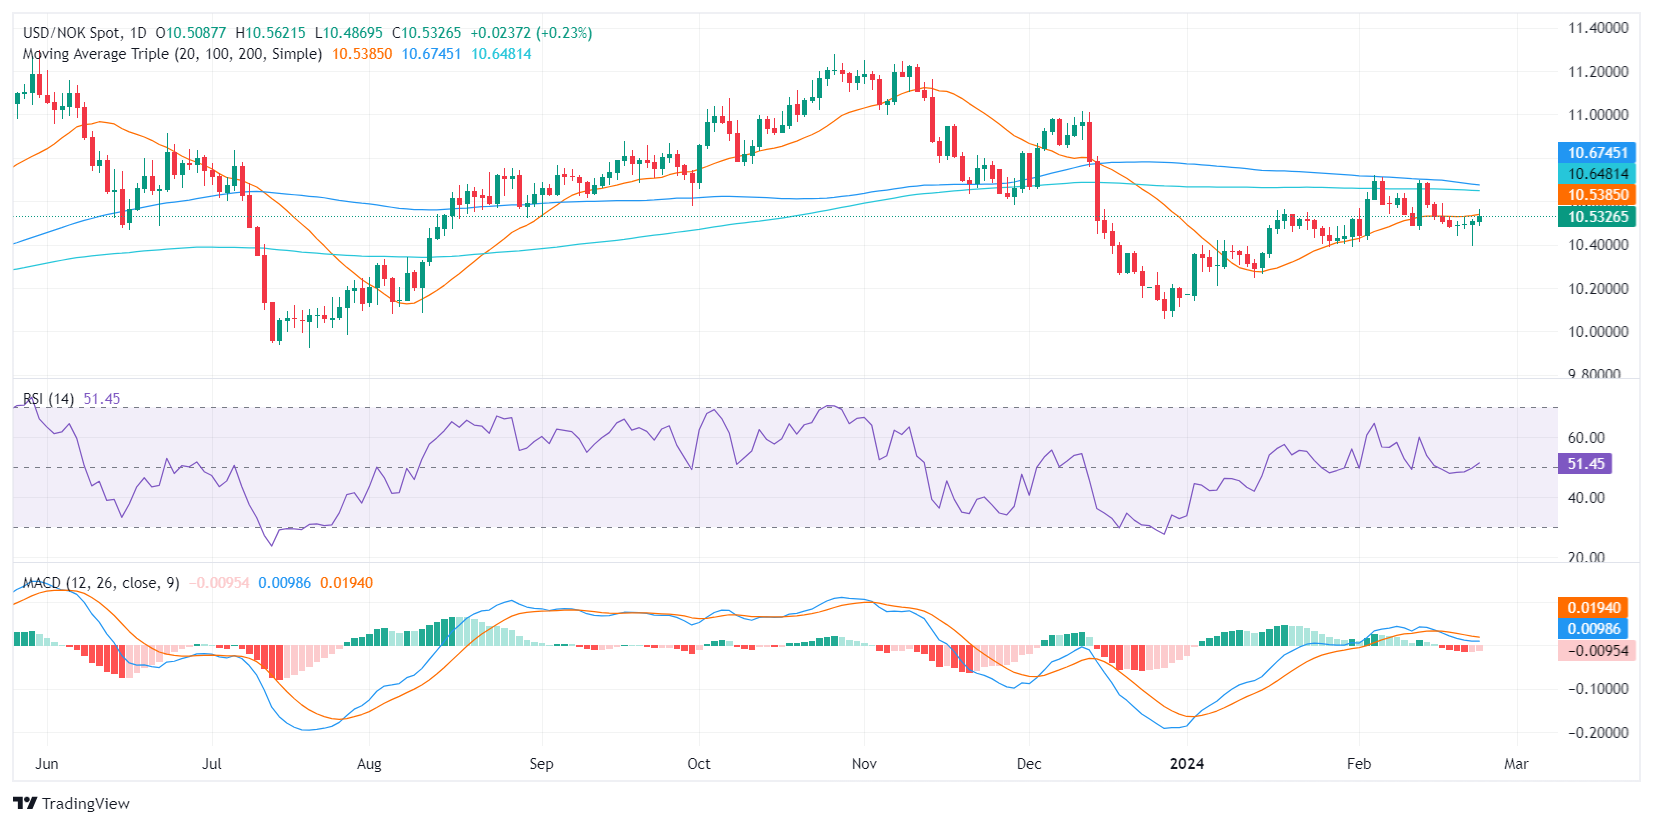
On the daily chart, the Relative Strength Index (RSI) for the USD/NOK is currently in positive territory. The upward slope indicates that buyers are beginning to assert control as the RSI readings moved from negative to positive region recently. 

Comparatively, the RSI on the hourly chart shows similar signs of buyer dominance as the readings fall within the positive territory. This reaffirms the presence of the buying sentiment in both short and long-term perspective. Nonetheless, this perspective is somewhat dampened by the Moving Average Convergence Divergence (MACD). The MACD shows red bars in the hourly and daily chart, indicating negative momentum despite being flat. This indicates the presence of sellers in the market, putting a halt to the buying pressure as reflected by the RSI.

In the broader context, the pair is below its 20, 100, and 200-day Simple Moving Averages (SMAs) which is indicative of a controlled bear market. However, the underlined strengthening buyer dominance seen from the RSI might provide a reversal in trend if it maintains its consistency.

USD/NOK daily chart

USD/NOK

Overview
Today last price10.5332
Today Daily Change0.0243
Today Daily Change %0.23
Today daily open10.5089
 
Trends
Daily SMA2010.5329
Daily SMA5010.419
Daily SMA10010.6783
Daily SMA20010.6499
 
Levels
Previous Daily High10.5195
Previous Daily Low10.3928
Previous Weekly High10.6955
Previous Weekly Low10.4653
Previous Monthly High10.5626
Previous Monthly Low10.1414
Daily Fibonacci 38.2%10.4711
Daily Fibonacci 61.8%10.4412
Daily Pivot Point S110.428
Daily Pivot Point S210.347
Daily Pivot Point S310.3012
Daily Pivot Point R110.5547
Daily Pivot Point R210.6005
Daily Pivot Point R310.6814

Author

Patricio Martín

Patricio is an economist from Argentina passionate about global finance and understanding the daily movements of the markets.

More from Patricio Martín
Share:

Markets move fast. We move first.

Orange Juice Newsletter brings you expert driven insights - not headlines. Every day on your inbox.

By subscribing you agree to our Terms and conditions.

Editor's Picks

EUR/USD trades around 1.1700 after rebounding from 50-day EMA

EUR/USD gains ground after three days of losses, trading around 1.1700 during the Asian hours on Wednesday. On the daily chart, technical analysis indicates a potential for a bearish bias; the 14-day Relative Strength Index at 47 confirms waning momentum.

GBP/USD climbs above 1.3500 as US Dollar weakens ahead of ISM Services PMI

GBP/USD gains some ground after registering modest gains in the previous session, trading around 1.3510 during the Asian hours on Wednesday. The pair edges higher as the US Dollar struggles ahead of the US ISM Services Purchasing Managers’ Index and JOLTs job openings due later in the day.

Gold pulls back from $4,500 amid profit-taking ahead of key US macro data

Gold struggles to capitalize on its strong weekly gains registered over the past two days and faces rejection near the $4,500 psychological mark, or over a one-week high touched during the Asian session on Wednesday. As investors digest the recent US attack on Venezuela, the prevalent risk-on environment prompts some profit-taking around the commodity. 

Bitcoin, Ethereum and Ripple cool off as rally stalls near key resistance zones

Bitcoin, Ethereum, and Ripple prices are taking a breather on Wednesday near their key resistance levels following the recent surge. BTC faces rejection at the $94,253 level, while ETH and XRP follow BTC’s footsteps, struggling near $3,308 and $2.35, respectively.

Implications of US intervention in Venezuela

Events in Venezuela are top of mind for market participants, and while developments are associated with an elevated degree of uncertainty, we are not making any changes to our markets or economic forecasts as a result of the deposition of Nicolás Maduro. 

Cardano holds steady as bulls intensify push for breakout

Cardano rises above the 50-day EMA resistance amid a risk-on mood across the crypto market. The MACD upholds positive divergence, increasing the potential for a 20% breakout to $0.505.