USD/NOK declines following Norway's Q4 GDP figures
- The USD/NOK trades at 10.60 in Wednesday's session, recording a strong 0.73% downturn.
- USD maintains consolidation post-CPI gains while NOK rides on firm Q4 GDP data.
- Rate cut expectations from the Fed diminish with January US CPI coming in hot.
- On the Norwegian side, impressive 0.2% mainland GDP growth in Q4 suggests that the Norges Bank may delay cuts.

In Wednesday's session, the USD/NOK has been seen trading at 10.60 following a 0.73% slide downwards. This movement comes after a slight consolidation of the USD post-Consumer Price Index (CPI) gains and a robust performance by the NOK, driven by firm Q4 Gross Domestic Product (GDP) data.
To add to that, the Federal Reserve’s (Fed) rate cut remains unlikely in the short-term, with the January US CPI running hot with headline and core readings beating expectations. The data indicates a solid economic condition, minimizing the chances of Fed easing. A notably worrying fact for the Federal Reserve is a rise in super core by 4.3% YoY from 3.9% in December, showcasing that inflationary pressure persists. Regardless, the odds for a rate cut in March linger around 10% and increase to a full expectation by June, which may limit the downside for the pair.
For Norway, mainland GDP grew by 0.2% in Q4 against Q3's 0.1%, propelled by consumer spending and net exports. The positive statistics are in line with Norges Bank's projections, affirming that they will likely maintain the policy rate at 4.5% for now. However, the swaps market forecasts a 50% chance of a rate cut in the next six months and if the Norwegian bank decides to delay cuts later than its American peer, the pair could see further downside.
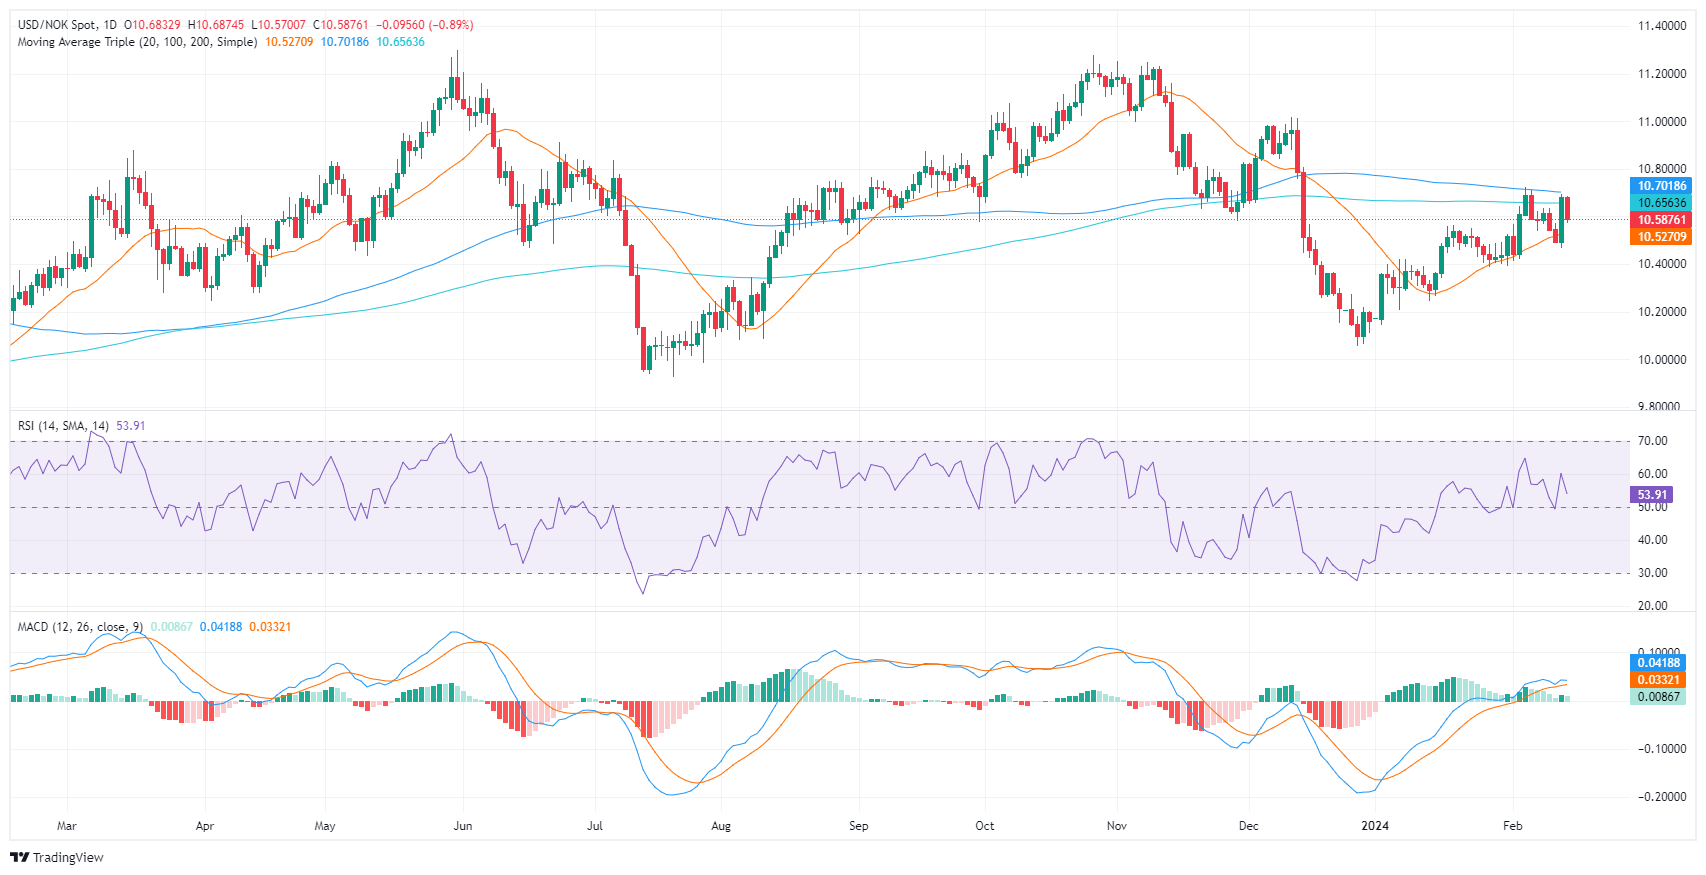
USD/NOK technical analysis
On the daily chart, the Relative Strength Index (RSI), it appears that the USDNOK pair has been fluctuating in the neutral zone, indicating a market with neither sellers nor buyers gaining control. Similarly, the Moving Average Convergence Divergence (MACD) histogram, although green, suggests a loss of bullish momentum as its bars have been decreasing in height recently.
When taking into account the pair’s relation to the Simple Moving Averages, a bearish control is seen on a larger scale, as the pair is below the 100 and 200-day SMAs. However, considering the pair remains above the 20-day SMA, the bearish forces appear to lack enough strength in the short term.
USD/NOK daily chart
Author

Patricio Martín
FXStreet
Patricio is an economist from Argentina passionate about global finance and understanding the daily movements of the markets.


