USD/MXN seesaws around $18.50s tilted downwards after US mixed data
- USD/MXN drops below $18.60 even though the US Dollar remains strong.
- US economic data was mixed, with Durable Good Orders showing some strains blamed on cumulative tightening by the Fed.
- USD/MX Price Analysis: Trapped within the 50/20-day EMAs.

USD/MXN stays depressed after drawing back-to-back hammers in the daily chart and slides; looking forward to testing the daily low of 18.5160. The USD/MXN fluctuates around 18.54 after hitting a daily high of 18.7968.
USD/MXN fluctuated, as a strong US Dollar, has capped the pair’s fall
Wall Street opened the last trading day of the week with losses. Bank’s riot continues, with Deutsche Bank (DB) Credit Default Swaps (CDS), a form of insurance in the case of a DB default, skyrocketing 220 basis points. Investor’s sentiment turned pessimistic, even though financial market participants estimated rate cuts by the US Federal Reserve (Fed).
Data-wise, the United States (US) economic docket revealed that business activity in March improved, above estimates and the prior’s month readings. Nevertheless, the S&P Global Manufacturing PMI fell short of expansion territory, at 49.3, but smashed estimates and February’s data.
At the same time, US Durable Good Orders plunged 1%, below forecasts of 0.6% but above the previous month’s 5% decline, reported the US Department of Commerce. Excluding transportation equipment, it remained unchanged. Albeit the report was better than January’s data, the cumulative tightening by the Federal Reserve (Fed) could begin to weigh on businesses, as traders are expecting a hard landing by the Fed.
US Treasury bond yields continued to edge lower. The US 18-month to 3-month yield curve deepened further, -1.28%, meaning that investors are estimating a recession in the US.
The US Dollar Index (DXY) found a bid, gains 0.60%, at 103.190, a reason that capped the USD/MXN earlier losses. Federal Reserve officials were one of the reasons that underpinned the greenback, with Bostic and Bullard saying that the US central bank needs to get inflation under control.
On the Mexican front, economic activity grew 0.6% in January from December, and 4.4% YoY from 2022, as said by INEGI. In the meantime, Banxicos’s deputy Governor Irene Espinosa noted that although inflation data is “good news,” Mexico remains in an uncertain environment. She added that Banxico’s primary concern is core inflation and that the bank would consider the Fed’s decision.
USD/MXN Technical analysis
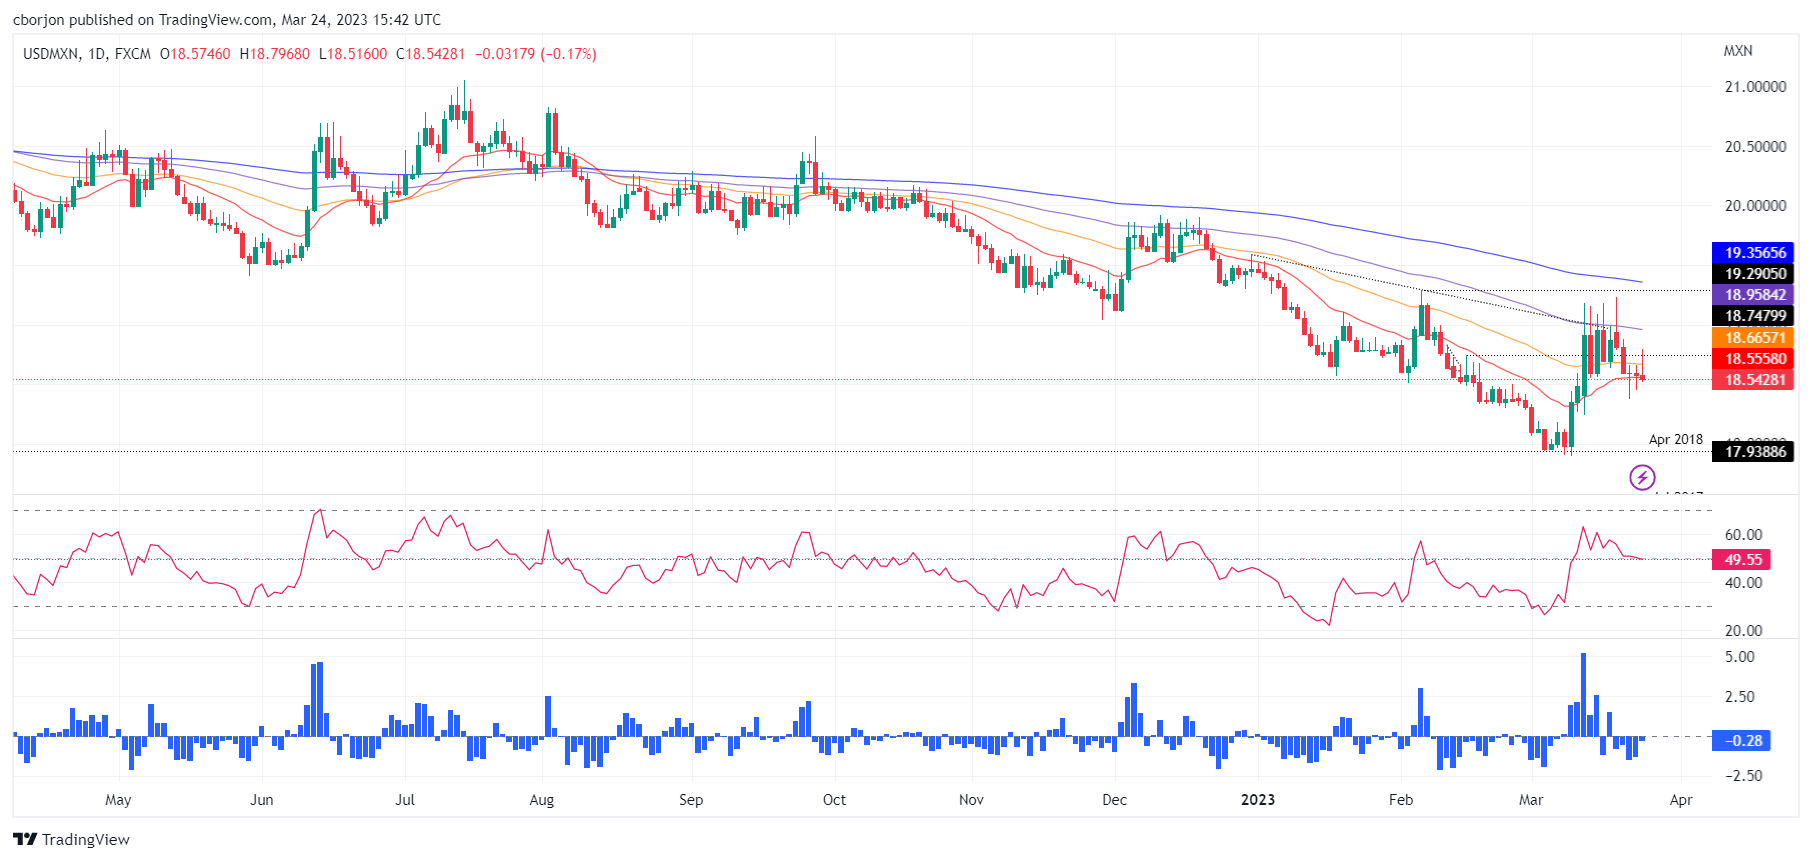
The USD/MXN continues under heavy stress, although it has recovered some ground. The pair’s jump to its daily high at 18.7968 was short-lived, as prices retreated below the 50-day Exponential Moving Average (EMA) at 18.6677. Oscillators like the Relative Strength Index (RSI) turned flat at bullish territory, while the Rate of Change (RoC) is neutral. A bullish resumption will occur if the USD/MXN reclaims the 50-day EMA. A breach of the latter will expose the March 21 high at 18.8769 and will put into play the 100-day EMA at 18.9590. Conversely, a bearish continuation would happen, with the USD/MXN stumbling below the 18.50 area.
Author

Christian Borjon Valencia
FXStreet
Markets analyst, news editor, and trading instructor with over 14 years of experience across FX, commodities, US equity indices, and global macro markets.


