USD/MXN rebounds from YTD lows, on strong USD despite weak US data
- USD/MXN trims losses, trading at around 17.50s, as weak US economic data prompts greenback buying.
- Disappointing US PPI and higher Initial Jobless Claims signal a slowing US economy, impacting the Mexican Peso.
- Investors watch US debt ceiling discussions, with President Biden resuming talks with Congress leaders on Friday.

USD/MXN trims some of its earlier losses, which sent the pair falling to new six-year lows in the New York session. But a tranche of economic data from the United States (US) prompted traders to buy the greenback, to the detriment of the emerging market currency, which is weakening close to 0.20%. At the time of writing, the USD/MXN is trading at 17.5917.
Emerging market currency falters as US Dollar rallies amid a slowing economy
An absent economic agenda in Mexico left the Mexican Peso (MXN) leaning on the dynamics of the greenback, which found a bid in the New York session and rallied sharply, as shown by the US Dollar Index (DXY). The DXY, a measure of the performance of six currencies vs. the US Dollar (USD), climbs 0.64%, up at 102.063, underpinned by weak US economic data.
The US calendar featured the Producer Price Index (PPI) for April, which came lower than expected, with readings at 2.3% YoY, below 2.4% forecasts; while the core PPI climbed 3.2% YoY, beneath estimates of 3.3%. Besides that, the Initial Jobless Claims for the last week exceeded estimates of 245K, with claims jumping to 264K. The data revealed that the US economy is slowing down, opening the door for the US central bank to hold rates unchanged at the upcoming June meeting and weakening the US Dollar.
In the last week, the US Federal Reserve lifted rates by 25 bps to the 5.00% - 5.25% area and Fed Chair Powell and Co. opened the door for a pause on its cycle. However, Jerome Powell stressed that on their baseline scenario, they’re not projecting rate cuts in 2023; but money market futures do. The CME FedWatch Tool shows investors are pricing 75 bps of rate cuts by the December 2023 meeting, estimating the Federal Funds Rate (FFR) to finish at around 4.25% - 4.50%.
In the meantime, Minnesota Fed President Neil Kashkari pushed back against rate cuts in 2023 and said that although inflation is cooling, it remains stickier. He added, “We will have to keep at it for an extended period.”
Investors are also watching the discussions regarding the US debt ceiling, which did not progress as expected. US President Joe Biden would resume talks with US Congress leaders on Friday.
Upcoming events
The US economic docket will feature the University of Michigan Consumer Sentiment and inflation expectations for one and five-year horizon, alongside Federal Reserve officials crossing the wires. The Mexican agenda will reveal Industrial Production in March, expected at -0.2% MoM and 2.7% YoY.
USD/MXN Price Analysis: Technical outlook
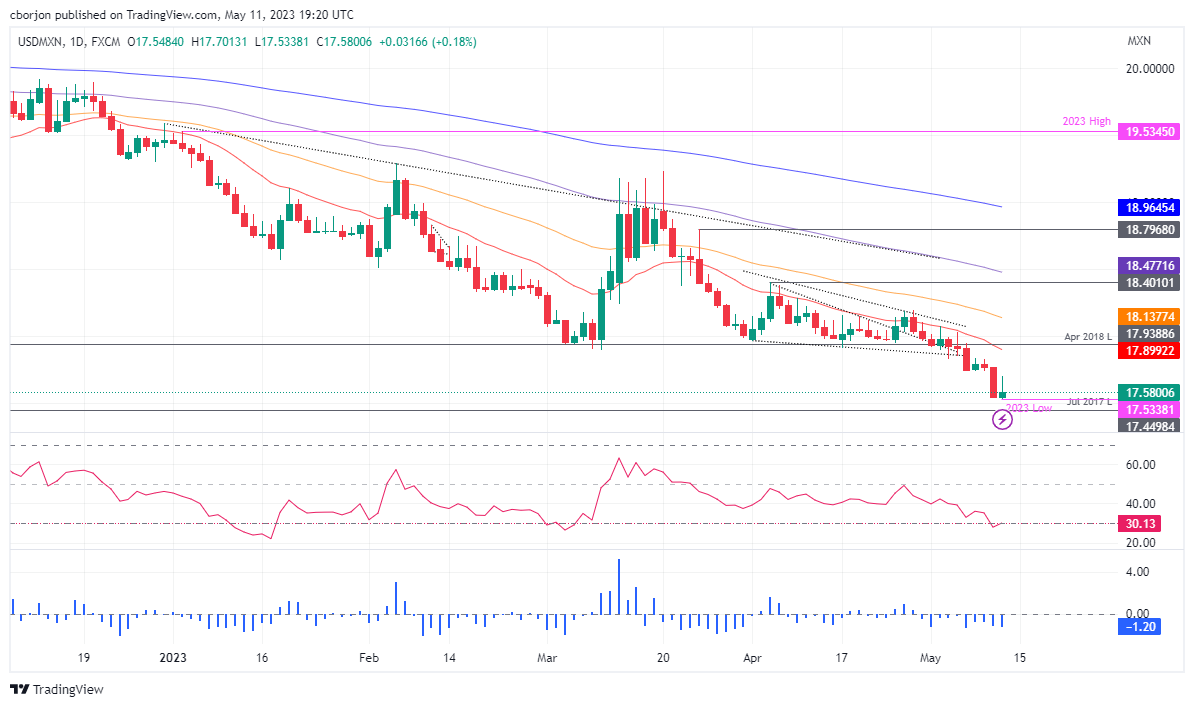
The USD/MXN remains in a strong downtrend, though it bounced off the weekly lows and recorded an inverted hammer at around the yearly lows. That indicates sellers are taking a respite before challenging the July 2017 low of 17.4498 before testing the 17.00 figure.
Oscillators like the Relative Strength Index (RSI) indicator and the 3-day Rate of Change (RoC) are in bearish territory, with the former at oversold conditions. Hence, further losses are expected in the USD/MXN.
Otherwise, if USD/MXN breaks above the May 10 daily high at 17.7724, that would expose the 20-day Exponential Moving Average (EMA) at 17.9004. Upside risks lie at 18.0000, which, once broken, buyers would pile in to test the 50-day EMA at 18.1382 before driving the price toward 18,50.
Author

Christian Borjon Valencia
FXStreet
Markets analyst, news editor, and trading instructor with over 14 years of experience across FX, commodities, US equity indices, and global macro markets.


