USD/MXN climbs to a three-week high on US Dollar strength, uncertainty in Mexican rails
- Uncertainty around the Mexican government seizing Grupo Mexico’s rail line triggers investor fears, leading to a sharp rise in USD/MXN.
- The unexpected military occupation of company facilities contradicts Mexican President AMLO’s campaign promises, impacting investor sentiment towards the Mexican Peso.
- Federal Reserve speakers and the resumption of US debt ceiling discussions add to the volatility of the USD/MXN pair, keeping traders on their toes.

USD/MXN rises sharply and reaches the 17.9609 three-week high courtesy of broad US Dollar (USD) strength, but also uncertainty around the Mexican government seizing Grupo Mexico’s rail line, increasing fears amongst investors in Mexico. Therefore, the USD/MXN opened the week at around 17.6960, but as of writing is trading at around the 17.85000area.
Mexican Peso dips as investors reposition amidst seizure concerns
An article posted by Bloomberg on Friday showed “A section of track in the state of Veracruz was deemed “of public utility” and transferred to a government entity that’s building a line across the Isthmus of Tehuantepec, a relatively narrow strip of land that separates the Pacific Ocean and the Gulf of Mexico.”
According to Bloomberg, “armed Navy personnel occupied company facilities on the Coatzacoalcos-Medias Aguas stretch of track beginning at 6 a.m. on Friday.” The takeover surprised the business community, contradicting campaign promises made by Mexican President Andres Manuel Lopez Obrador that his government wouldn’t seize private property.
Therefore, investors buying the Mexican Peso amidst its political stability and higher interest rates by the Bank of Mexico (Banxico) at 11.25% began to book profits and reposition themselves as the week started. Earlier in the Asian session, the USD/MXN commenced the week at 17.6960, but in one hour of trading, it jumped 1000 pips, toward 17.7957 on uncertainty about the outcome of the Mexican government’s actions.
Aside from this, US debt ceilings discussions would resume on Monday, as US President Joe Biden returned from the G7 reunion. On Friday, the Republicans stepped out from a reunion, halting the negotiations. The US Treasury Secretary Janet Yellen said that chances that the US can pay its bill by mid-June are trimming.
In the meantime, a light US economic agenda keep USD/MXN traders entertained on further Federal Reserve speakers. The Minnesota Fed President Neil Kashkari said, “I think right now it’s a close call, either way, versus raising another time in June or skipping. What’s important to me is not signaling that we’re done.” Of late, James Bullard, the President of the St. Louis Fed, commented he’s thinking of two more rate hikes this year.
Upcoming events
The US economic calendar will feature additional Federal Reserve speakers alongside the report of final figures of the S&P Global PMIs on Tuesday. On the Mexican front, the agenda will feature the 1st half-month of Inflation and Core Inflation in May.
USD/MXN Price Analysis: Technical outlook
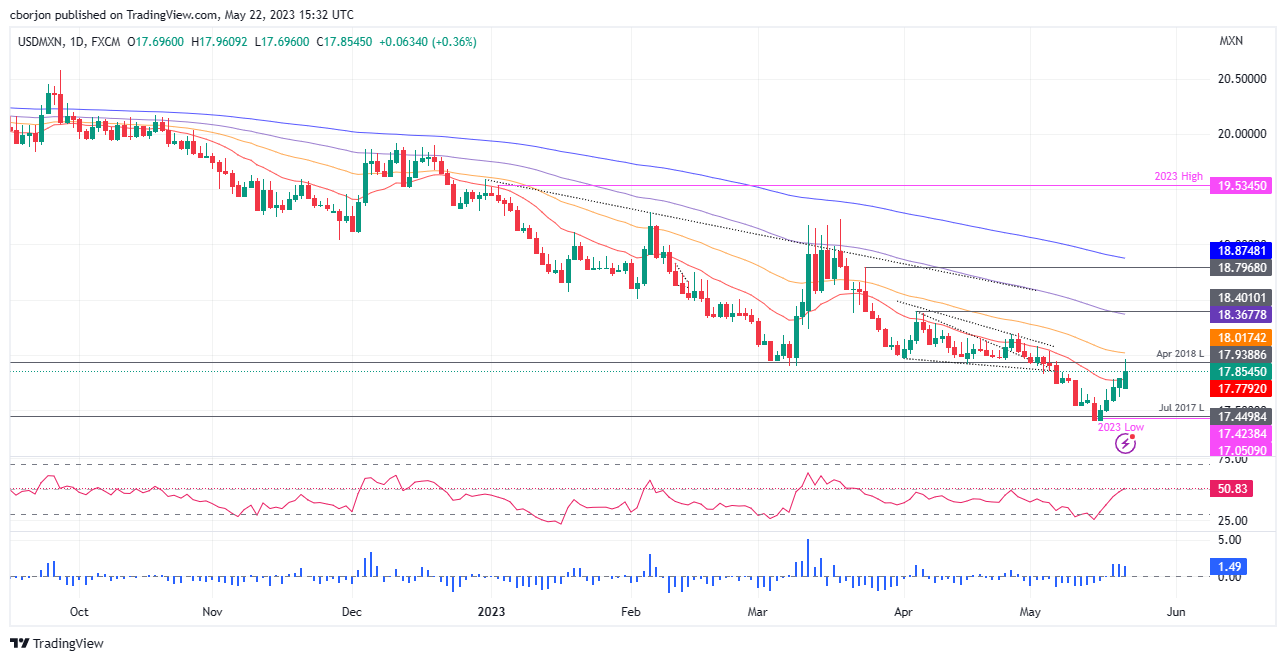
From a technical perspective, the USD/MXN is still neutral to downward biased. However, the slight recovery on Monday threatened to crack the 18.0000 figure, ahead of the 50-day Exponential Moving Average (EMA) at 18.01782. Notably, the Relative Strength Index (RSI) indicator has turned bullish, piercing the 50-midline, which could open the door for further buying strength. Upside risks lie at the May 22 high of 17.9609, followed by the confluence of the 50-day EMA and the 18.0000 figure. A breach of the latter will expose the 100-day EMA at 18.3678. On the other hand, a bearish continuation is likely to happen, below the 20-day EMA at 17.7794 and toward the YTD low of 17.4238.
Author

Christian Borjon Valencia
FXStreet
Markets analyst, news editor, and trading instructor with over 14 years of experience across FX, commodities, US equity indices, and global macro markets.


