|

USD/JPY technical analysis: Not even the Fed can break this range

  • USD/JPY remains trapped in its range between 108.00 support and 108.70 resistance 
  • The level to beat for bulls is 108.20 according to the Technical Confluences Indicator.
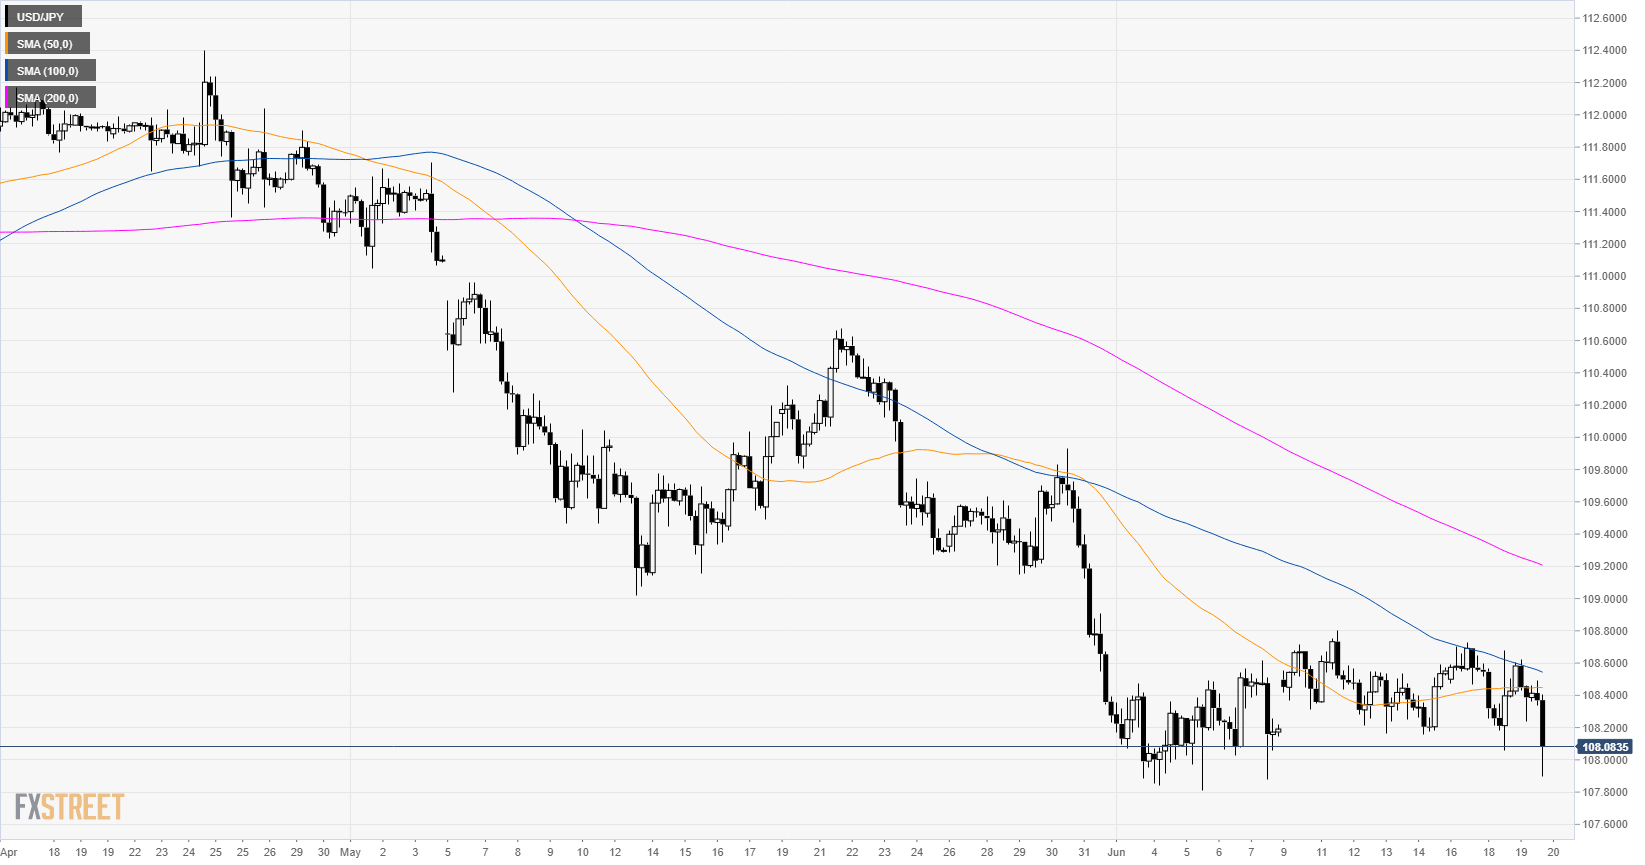
USD/JPY daily chart 

USD/JPY is in a bear trend below its main daily simple moving averages (DSMAs). The 50 DSMA crossed below the 100 DSMA which is seen as bearish. USD/JPY remains trapped in its consolidation despite the Fed dovish message.


USD/JPY 4-hour chart

USD/JPY is under bearish pressure below its main SMAs.

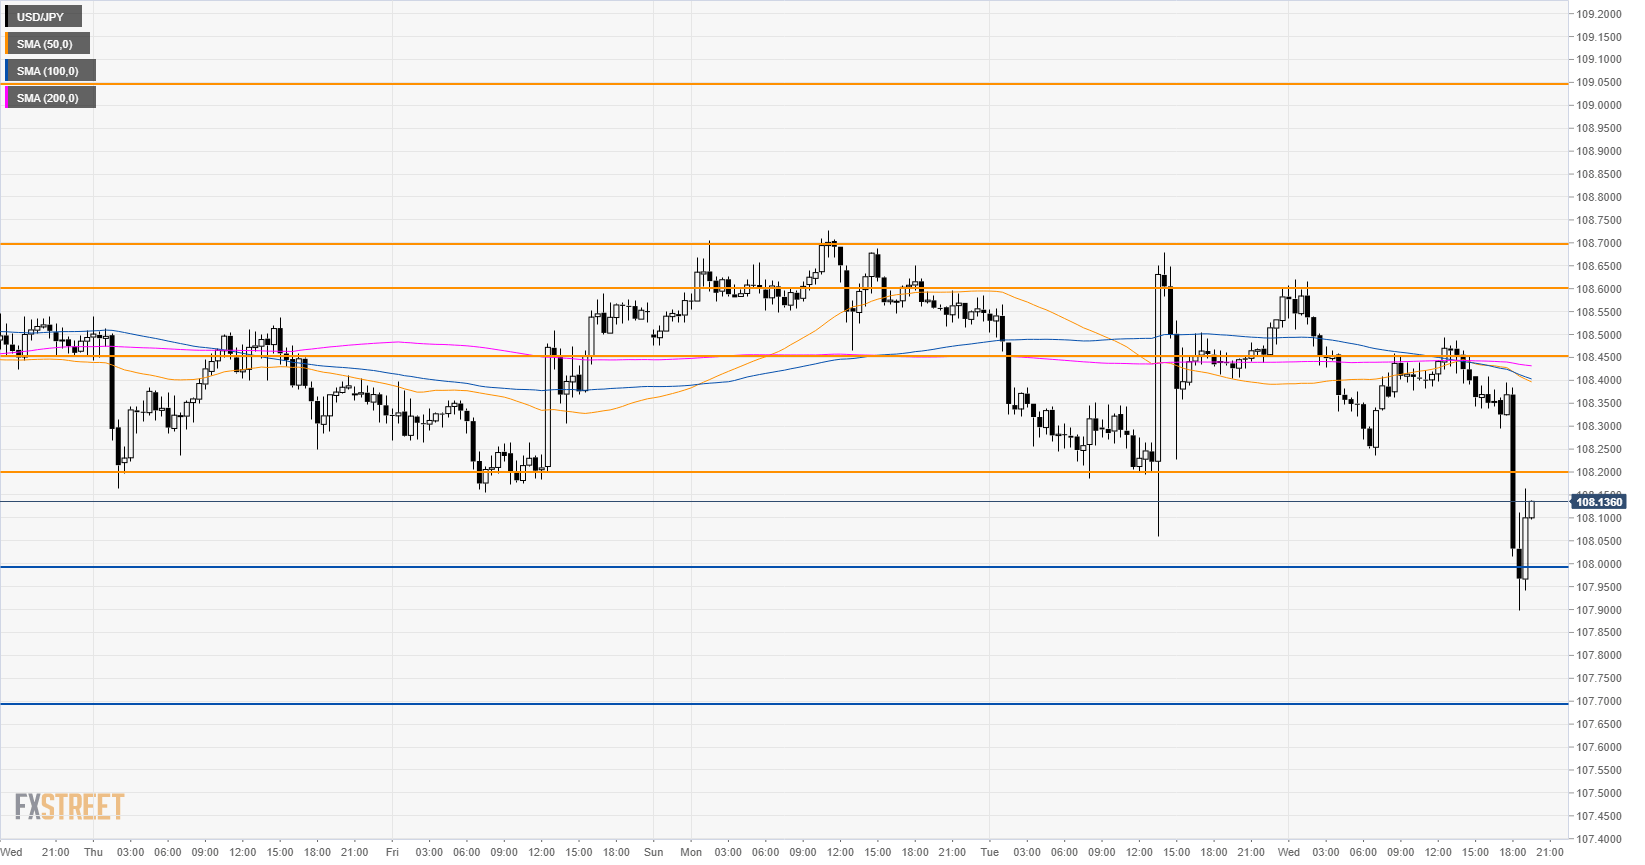
USD/JPY 30-minute chart

The market dipped briefly below 108.00 figure but the support held and USD/JPY remains in range. According to the Technical Confluences Indicator, there is moderate resistance at 108.20 (last week low and the lower Bollinger Band on the 1-hour chart) followed by 108.45 (simple moving averages cluster). Further lies 108.70 resistance (Fibonacci cluster). A break above this level can potentially lead to 108.84 (near the previous week high and the weekly pivot point resistance 1). Support is at 108.00 and 107.70.


Additional key levels

USD/JPY

Overview
Today last price108.12
Today Daily Change-0.32
Today Daily Change %-0.30
Today daily open108.44
 
Trends
Daily SMA20108.81
Daily SMA50110.14
Daily SMA100110.48
Daily SMA200111.21
Levels
Previous Daily High108.68
Previous Daily Low108.06
Previous Weekly High108.8
Previous Weekly Low108.16
Previous Monthly High111.71
Previous Monthly Low108.23
Daily Fibonacci 38.2%108.3
Daily Fibonacci 61.8%108.44
Daily Pivot Point S1108.11
Daily Pivot Point S2107.77
Daily Pivot Point S3107.49
Daily Pivot Point R1108.73
Daily Pivot Point R2109.02
Daily Pivot Point R3109.35

Author

Flavio Tosti

Flavio Tosti

Independent Analyst


More from Flavio Tosti
Share:

Editor's Picks

EUR/USD: US Dollar to remain pressured until uncertainty fog dissipates

Unimpressive European Central Bank left monetary policy unchanged for the fifth consecutive meeting. The United States first-tier employment and inflation data is scheduled for the second week of February. EUR/USD battles to remain afloat above 1.1800, sellers moving to the sidelines.

GBP/USD reclaims 1.3600 and above

GBP/USD reverses two straight days of losses, surpassing the key 1.3600 yardstick on Friday. Cable’s rebound comes as the Greenback slips away from two-week highs in response to some profit-taking mood and speculation of Fed rate cuts. In addition, hawkish comments from the BoE’s Pill are also collaborating with the quid’s improvement.

Gold: Volatility persists in commodity space

After losing more than 8% to end the previous week, Gold remained under heavy selling pressure on Monday and dropped toward $4,400. Although XAU/USD staged a decisive rebound afterward, it failed to stabilize above $5,000. The US economic calendar will feature Nonfarm Payrolls and Consumer Price Index data for January, which could influence the market pricing of the Federal Reserve’s policy outlook and impact Gold’s performance.

Week ahead: US NFP and CPI data to shake Fed cut bets, Japan election looms

US NFP and CPI data awaited after Warsh’s nomination as Fed chief. Yen traders lock gaze on Sunday’s snap election. UK and Eurozone Q4 GDP data also on the agenda. China CPI and PPI could reveal more weakness in domestic demand.

Three scenarios for Japanese Yen ahead of snap election

The latest polls point to a dominant win for the ruling bloc at the upcoming Japanese snap election. The larger Sanae Takaichi’s mandate, the more investors fear faster implementation of tax cuts and spending plans. 

XRP rally extends as modest ETF inflows support recovery

Ripple is accelerating its recovery, trading above $1.36 at the time of writing on Friday, as investors adjust their positions following a turbulent week in the broader crypto market. The remittance token is up over 21% from its intraday low of $1.12.