|

USD/JPY technical analysis: Greenback off monthly lows, parked below the 108.00 figure

  • USD/JPY is off the monthly lows as bulls are challenging the 108.00 figure.
  • The levels to beat for buyers are at 108.03 and 108.27.
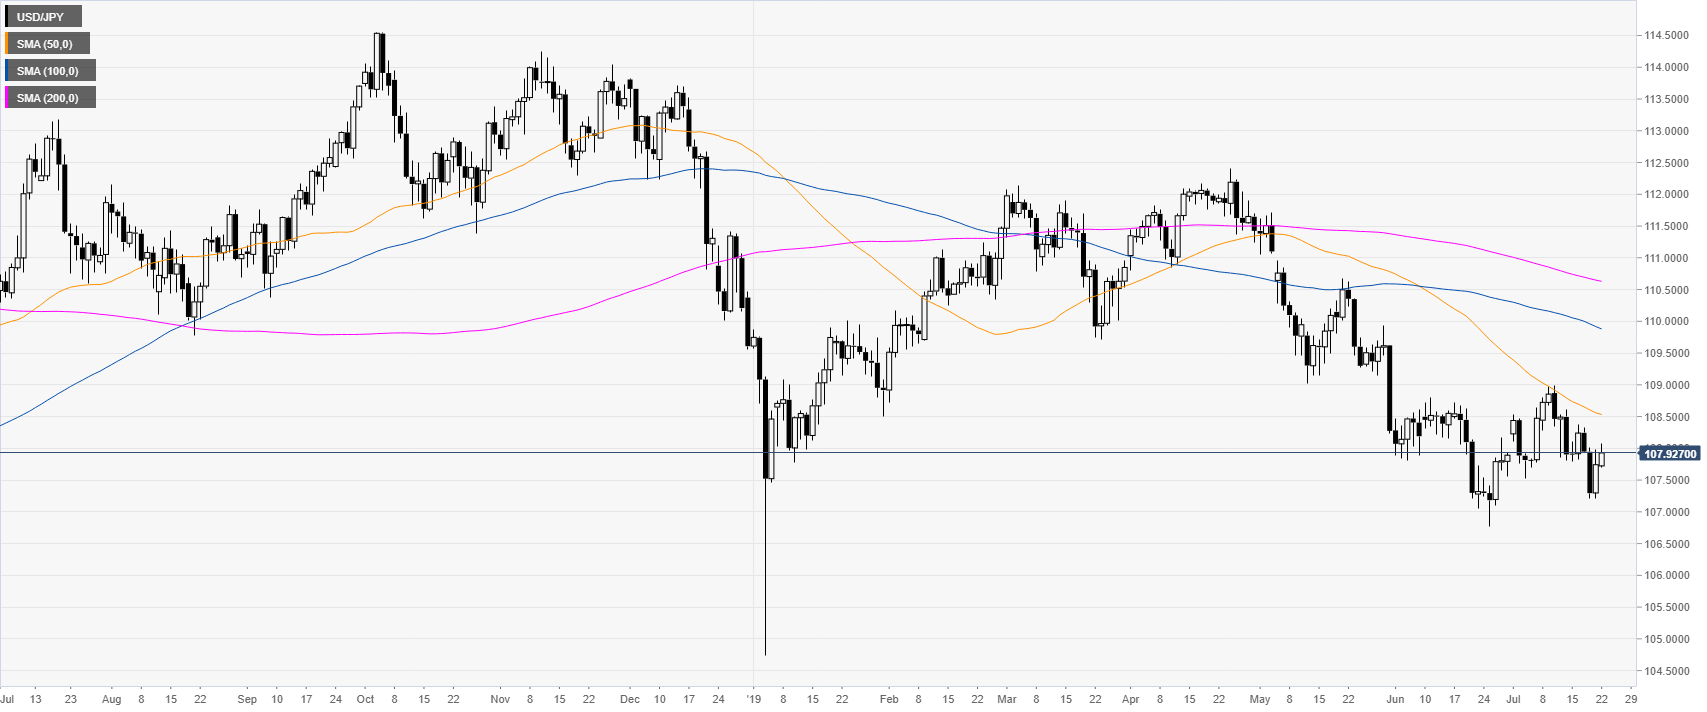
USD/JPY daily chart


USD/JPY is up on the day as the market is trading below its main SMAs. The market is trading just below the 108.00 figure.


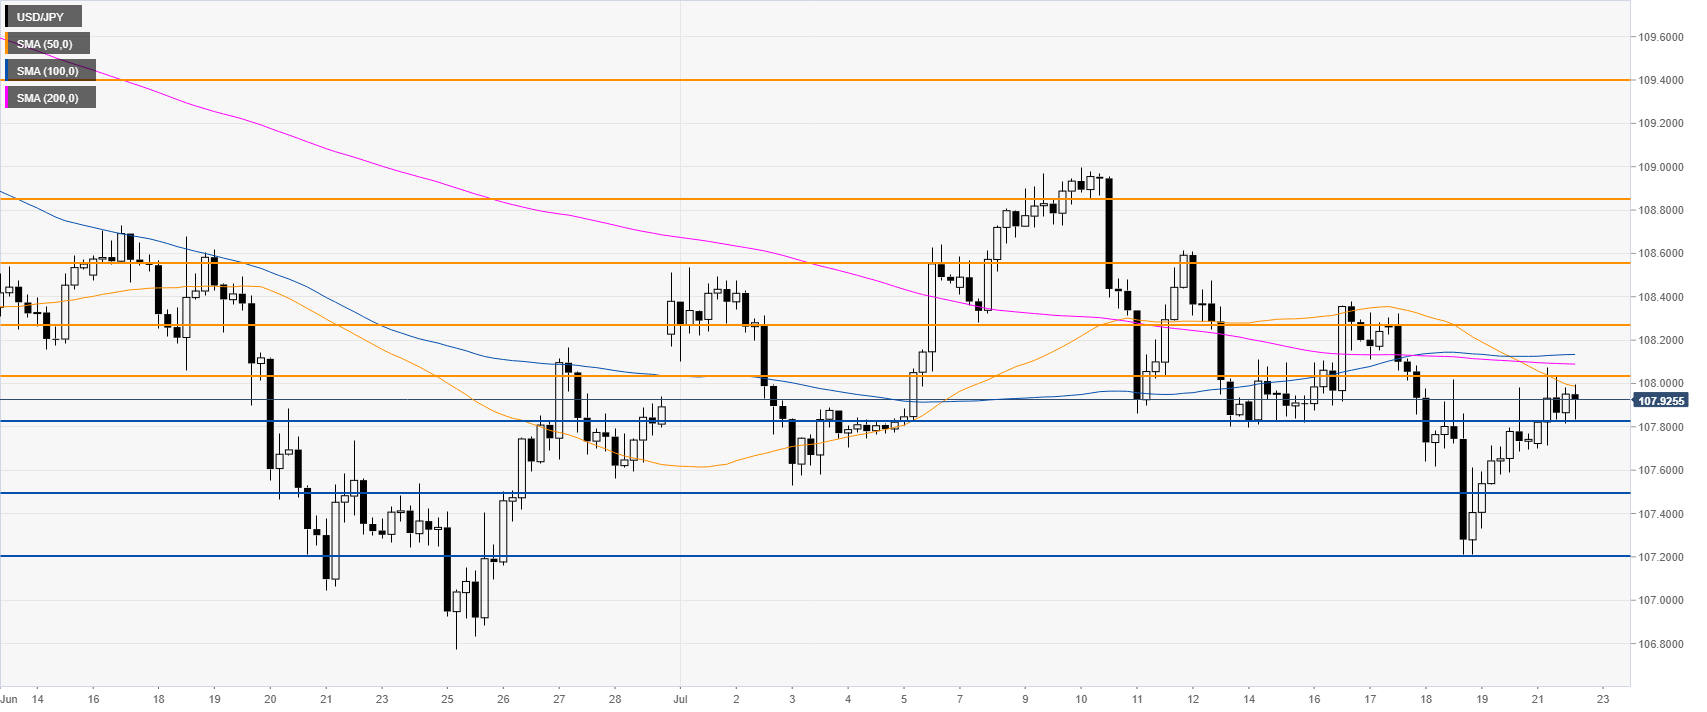
USD/JPY 4-hour chart


USD/JPY is trading below the main SMAs as the market is rebounding from the monthly lows. Bears need to break below 107.83 to reach 107.20 on the way down, according to the Technical Confluences Indicator


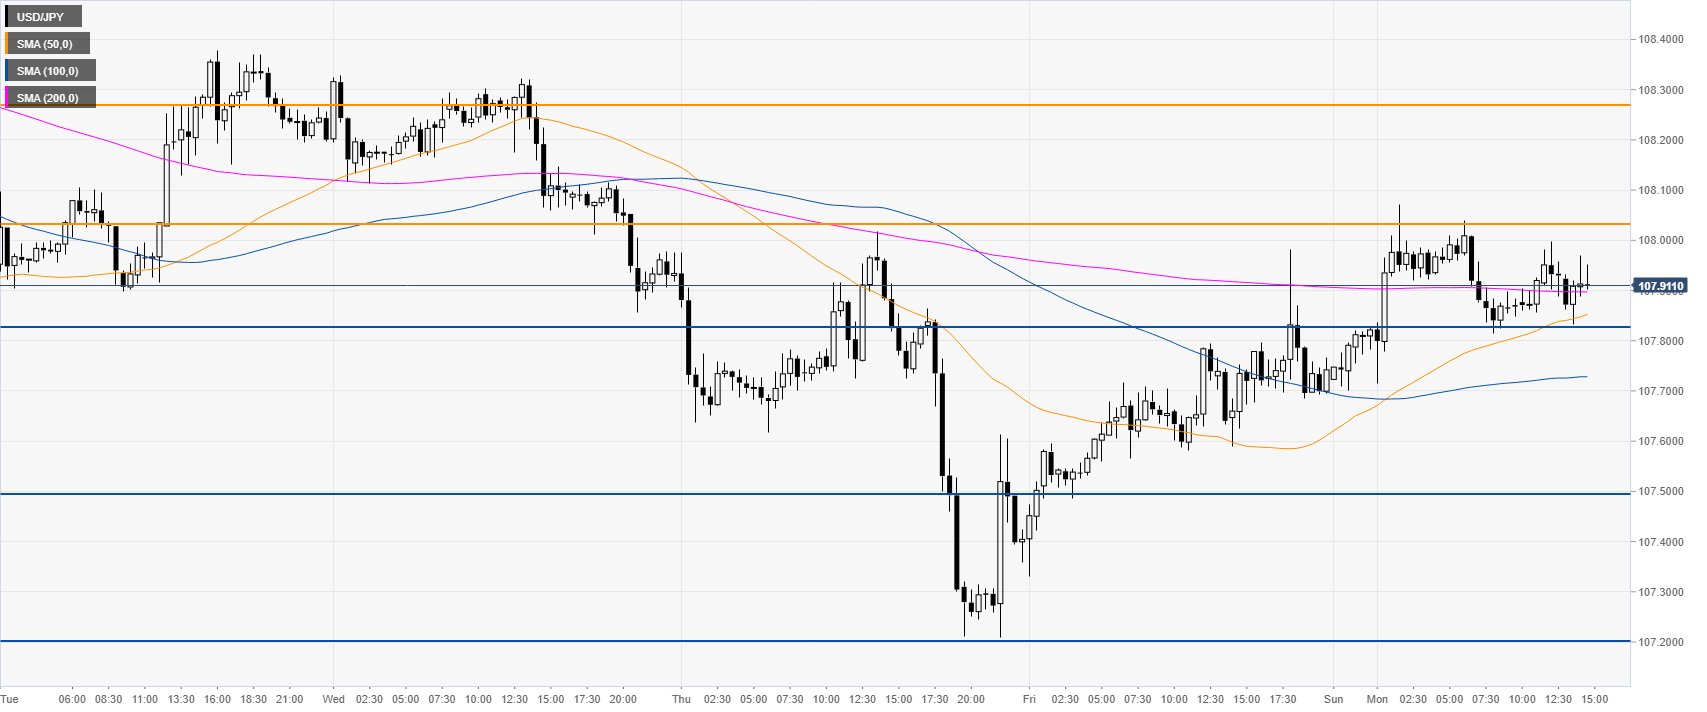
USD/JPY 30-minute chart


USD/JPY is trading above its main SMAs suggesting bullish momentum in the near term. Dollar bulls would need to overcome 108.03 to reach 108.27 resistance


Additional key levels

USD/JPY

Overview
Today last price107.91
Today Daily Change0.17
Today Daily Change %0.16
Today daily open107.74
 
Trends
Daily SMA20108
Daily SMA50108.56
Daily SMA100109.92
Daily SMA200110.65
Levels
Previous Daily High107.98
Previous Daily Low107.21
Previous Weekly High108.38
Previous Weekly Low107.21
Previous Monthly High108.8
Previous Monthly Low106.78
Daily Fibonacci 38.2%107.69
Daily Fibonacci 61.8%107.5
Daily Pivot Point S1107.31
Daily Pivot Point S2106.87
Daily Pivot Point S3106.54
Daily Pivot Point R1108.08
Daily Pivot Point R2108.42
Daily Pivot Point R3108.85

Author

Flavio Tosti

Flavio Tosti

Independent Analyst


More from Flavio Tosti
Share:

Editor's Picks

EUR/USD remains depressed below mid-1.1800s; downside potential seems limited

The EUR/USD pair attracts some sellers for the second consecutive day on Tuesday and hovers below mid-1.1800s amid a relatively quiet trading action during the Asian session. The broader fundamental backdrop, however, warrants some caution for bearish traders before positioning for deeper losses.

When is the UK employment data and how could it affect GBP/USD?

The United Kingdom labor market data for the three months ending December is scheduled to be published today at 07:00 GMT.  GBP/USD trades 0.16% lower to near 1.3610 at the press time. The 20-period Exponential Moving Average slips to 1.3631 and caps rebounds as price holds below the gauge.

Gold downside appears capped ahead of US-Iran talks

Gold is off the lows but remains under moderate selling pressure below the $5,000 threshold early Tuesday. Gold now looks to the US-Iran nuclear deal talks for a fresh trading impetus as US traders return after the long weekend.

Jupiter rises on native SOL staking, TVL rebound

Jupiter edges higher by 3% at press time on Tuesday, approaching the $0.1700 level. The lending protocol announced native staking as collateral, allowing users to borrow against natively staked SOL on certain vaults.

The week ahead: Key inflation readings and why the AI trade could be overdone

It is likely to be a quiet start to the week, with US markets closed on Monday for Presidents Day. European markets are higher across the board and gold is clinging to the $5,000 level after the tamer than expected CPI report in the US reduced haven flows to precious metals.

XRP steadies in narrow range as fund inflows, futures interest rise

Ripple is trading in a narrow range between $1.45 (immediate support) and $1.50 (resistance) at the time of writing on Monday. The remittance token extended its recovery last week, peaking at $1.67 on Sunday from the weekly open at $1.43.