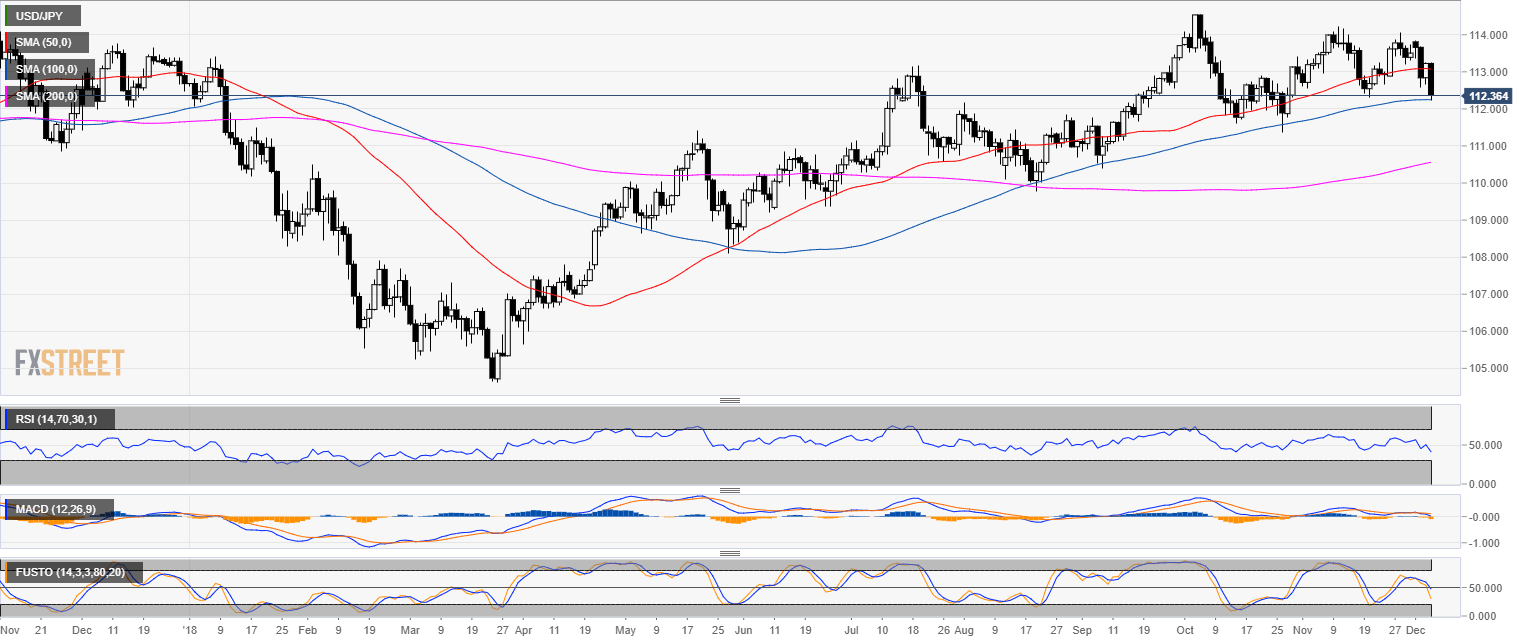
USD/JPY daily chart
- USD/JPY is in a bull trend above the 200-day simple moving average (SMA).
- USD/JPY found some support at the 100 SMA.
- Safe haven Yen was in demand as US indices are trading down.
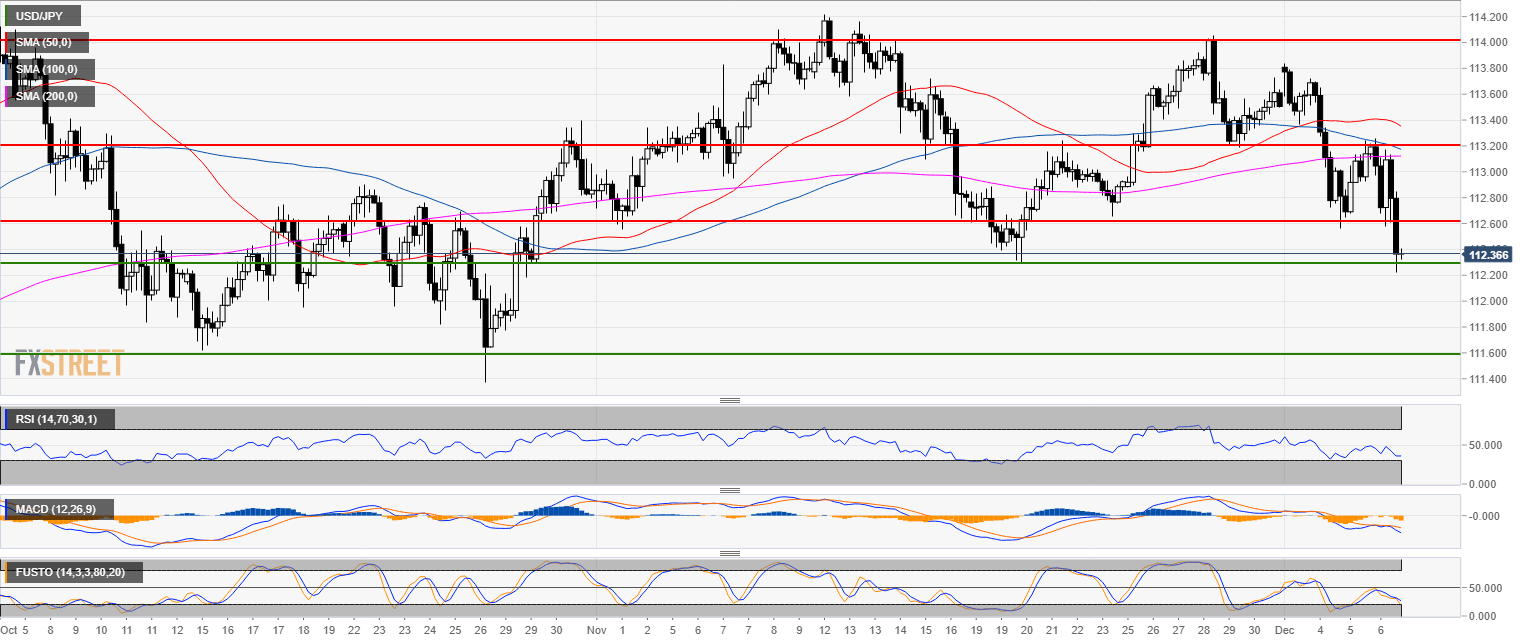
USD/JPY 4-hour chart
- USD/JPY is trading below its main SMAs.
- USD/JPY is testing November lows at the 112.20 level.
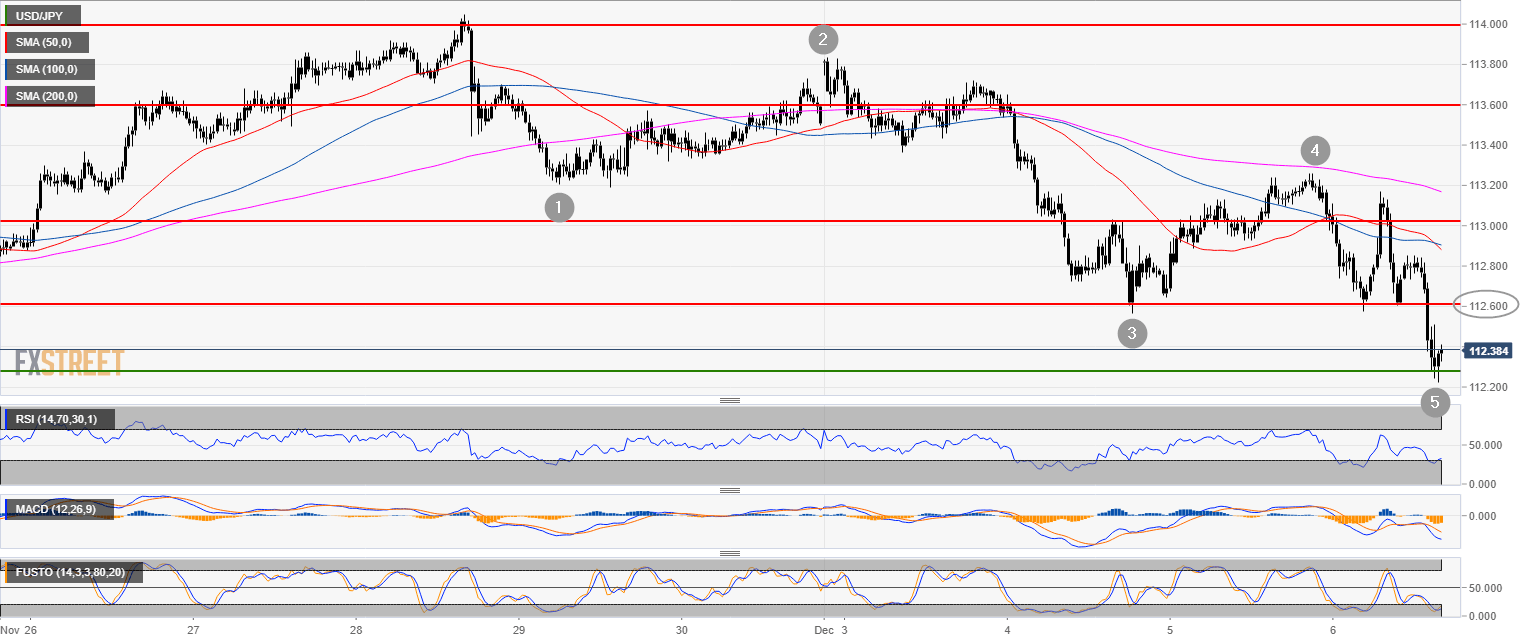
USD/JPY 30-minute chart
- As USD/JPY created a 5-wave pattern, bulls might find support at 112.20.
- The next bullish target is seen at 112.60.
Additional key levels
USD/JPY
Overview:
Today Last Price: 112.36
Today Daily change: -86 pips
Today Daily change %: -0.760%
Today Daily Open: 113.22
Trends:
Previous Daily SMA20: 113.35
Previous Daily SMA50: 113.09
Previous Daily SMA100: 112.25
Previous Daily SMA200: 110.52
Levels:
Previous Daily High: 113.24
Previous Daily Low: 112.65
Previous Weekly High: 114.04
Previous Weekly Low: 112.88
Previous Monthly High: 114.25
Previous Monthly Low: 112.3
Previous Daily Fibonacci 38.2%: 113.02
Previous Daily Fibonacci 61.8%: 112.88
Previous Daily Pivot Point S1: 112.83
Previous Daily Pivot Point S2: 112.44
Previous Daily Pivot Point S3: 112.24
Previous Daily Pivot Point R1: 113.43
Previous Daily Pivot Point R2: 113.63
Previous Daily Pivot Point R3: 114.02
Note: All information on this page is subject to change. The use of this website constitutes acceptance of our user agreement. Please read our privacy policy and legal disclaimer. Opinions expressed at FXstreet.com are those of the individual authors and do not necessarily represent the opinion of FXstreet.com or its management. Risk Disclosure: Trading foreign exchange on margin carries a high level of risk, and may not be suitable for all investors. The high degree of leverage can work against you as well as for you. Before deciding to invest in foreign exchange you should carefully consider your investment objectives, level of experience, and risk appetite. The possibility exists that you could sustain a loss of some or all of your initial investment and therefore you should not invest money that you cannot afford to lose. You should be aware of all the risks associated with foreign exchange trading, and seek advice from an independent financial advisor if you have any doubts.
Recommended content
Editors’ Picks
EUR/USD holds below 1.0750 ahead of key US data

EUR/USD trades in a tight range below 1.0750 in the European session on Friday. The US Dollar struggles to gather strength ahead of key PCE Price Index data, the Fed's preferred gauge of inflation, and helps the pair hold its ground.
GBP/USD consolidates above 1.2500, eyes on US PCE data

GBP/USD fluctuates at around 1.2500 in the European session on Friday following the three-day rebound. The PCE inflation data for March will be watched closely by market participants later in the day.
Gold clings to modest daily gains at around $2,350

Gold stays in positive territory at around $2,350 after closing in positive territory on Thursday. The benchmark 10-year US Treasury bond yield edges lower ahead of US PCE Price Index data, allowing XAU/USD to stretch higher.
Bitcoin Weekly Forecast: BTC’s next breakout could propel it to $80,000 Premium

Bitcoin’s recent price consolidation could be nearing its end as technical indicators and on-chain metrics suggest a potential upward breakout. However, this move would not be straightforward and could punish impatient investors.
US core PCE inflation set to signal firm price pressures as markets delay Federal Reserve rate cut bets

The core PCE Price Index, which excludes volatile food and energy prices, is seen as the more influential measure of inflation in terms of Fed positioning. The index is forecast to rise 0.3% on a monthly basis in March, matching February’s increase.