USD/JPY stumbles to a one-month low as US CPI slows, US bond yields dive
- USD/JPY pair plunges to a one-month low as US inflation data surprise and Treasury yields fall, putting pressure on USD.
- Despite inflation dropping closer to the target, a dovish stance from the Fed weighs on the already battered USD.
- The disappointing Japanese core machinery orders data hints at a potential global economic slowdown, supporting the BoJ’s dovish outlook.

USD/JPY sinks to new one-month lows after reaching 138.15 in the North American session after US Consumer Price Index (CPI) figures for June revealed that prices are slowing down as CPI dips to its lowest level in two years. In addition, falling US Treasury bond yields weighed on the USD/JPY pair, which correlates closely to the US 10-year Treasury note yield. At the time of writing, the USD/JPY trades at 138.30, down 1.45%.
The Yen's win: Decelerating US inflation and falling bond yields undercut the US Dollar
US CPI, revealed by the US Bureau of Labor Statistics (BLS), showed inflation in the United States experiencing a significant slowdown in June. CPI annually based increased by 3.0%, below the estimated 3.1%. Furthermore, the Core CPI, which excludes volatile items such as food and energy, decreased by 0.5%, dropping from 5.3% in May to 4.8% last month. Although the report showed inflation deflating towards the Fed’s 2% target, Federal Reserve (Fed) officials stated their priority is bringing it down, as expressed today by Richmond and Minnesota Fed Presidents Thomas Barkin and Neil Kaskhari.
Barkind stated that inflation is too high while favoring higher rates. Kashkari echoed some of his comments, commenting that the Fed’s fight vs. inflation needs to be won, and rates must be lifted if prices remain elevated.
In the meantime, the already battered US Dollar (USD) continued to weaken to new two-month lows, as shown by the US Dollar Index (DXY). The DXY, a measure of the buck’s performance against a basket of peers, tumbles more than 1%, down at 100.560.
Expectations for additional tightening by the Fed remain unchanged at 92.4% for a 25 bps rate hike in July. However, further increases past the current month are off the table, as shown by the CME FedWatch Tool.
On the Japanese front, the economic docket revealed that Core Machinery Orders fell -7.6%, below estimates of a 1% gain, crushing April’s 5.5% expansion, suggesting a deceleration of the Japanese economy. Although the wages rise In Japan is the largest since 1993, the latest inflation figures in China, alongside disappointing machinery orders, put into play a possible global economic slowdown. That said, it justifies the Bank of Japan’s (BoJ) dovish stance, at least in the medium term.
USD/JPY Price Analysis: Technical outlook
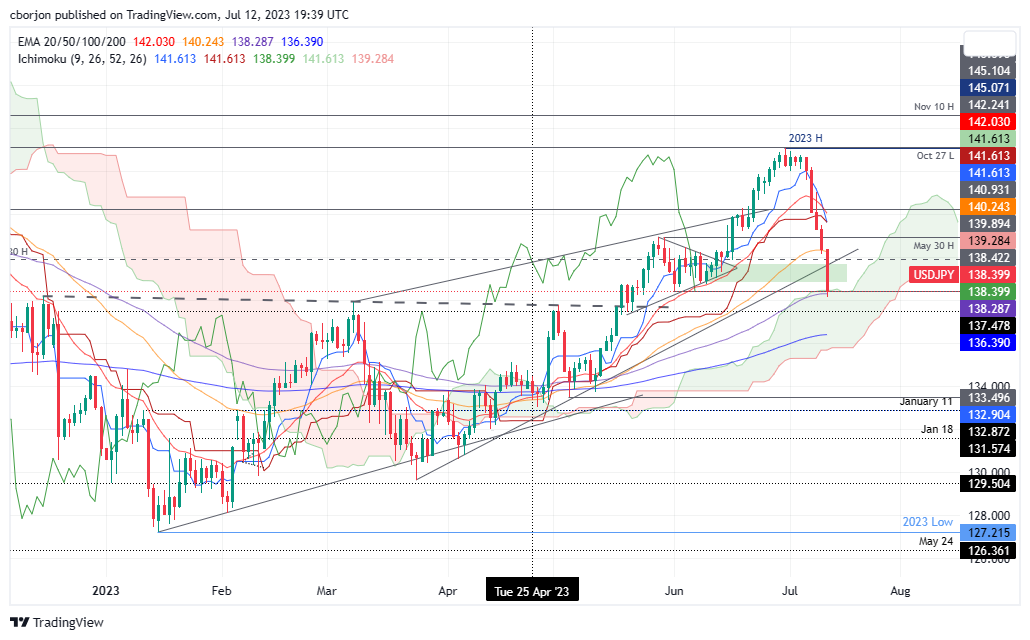
The USD/JPY daily chart shows the pair hovering above the Ichimoku Cloud, which intersects with the 100-day Exponential Moving Average (EMA) at around 138.28/38. That area is considered solid support, but the ip below the cross-over of the Tenkan-Sen below the Kijun-Sen is seen as a bearish signal. But the size of the drop, with twice the Average True Range of 100 pips, suggests the USD/JPY price could be overextended. A bearish continuation will occur if USD/JPY slips past 138.00, which would put in play the 200-day EMA at 136.38 as the next support. Contrarily, if USD/JPY bounces off the weekly lows and reclaims 139.00, that could pave the way for recovery and resumption of the uptrend.
Author

Christian Borjon Valencia
FXStreet
Markets analyst, news editor, and trading instructor with over 14 years of experience across FX, commodities, US equity indices, and global macro markets.


