USD/JPY sinks to two-month low amid softening US inflation, Fed rate hike speculations
- US inflation seems to be easing, with June’s Producer Price Index (PPI) missing estimates and the previous month’s data. The Core PPI, excluding volatile items, also showed signs of weakening.
- The Federal Funds Rate (FFR) is expected to peak at 5.25%-5.50% for the remainder of the year, according to money market futures, despite softening inflation data.
- Japanese households expect higher inflation levels, averaging 10.5% for next year, well above the BoJ’s 2% target.

The USD/JPY extended its losses for the sixth consecutive trading session and broke to a new two-month low of 137.92 on speculations the US Federal Reserve would hike in July to reach its peak rates as inflation continued to ease. Hence, the USD/JPY is trading at 137.98, below the psychological 138.00 figure, after hitting a daily high of 138.95.
Yen strengthens as the USD softens, following disappointing US PPI data and low bond yields
Inflation in the United States (US) is edging lower after data revealed that the June Producer Price Index (PPI) missed estimates of the downside following Wednesday’s consumer inflation report. PPI expanded at a 0.1% YoY pace, beneath forecasts of 0.4%, and lower than May 1.1%, while Core PPI, which strips volatile items, showed signs of losing steam and expanded at a 2.4% YoY pace, below estimates of 2.6% and the previous month’s 2.8%.
Although the data would justify a pause on the Fed’s tightening cycle, money market futures think otherwise. According to the CME FedWatcth Tool, odds for a quarter of a percentage increase lie above 90%. Even though Fed Chair Jerome Powell and some of his colleagues expressed that “a couple” of increases are pending, investors pared those bets. That said, the Federal Funds Rate (FFR) is expected to peak at 5.25%-5.50% for the remainder of the year.
That would likely keep the greenback pressured, as shown by the US Dollar Index (DXY). The DXY, which tracks the buck’s performance against other currencies, tumbled to a new 15-month low of 99.741, losing 0.80%. Another factor weighed by lower inflation levels in the US is bond yields, with the US 10-year note rate sitting at 3.767%, down nine basis points.
Therefore, the USD/JPY has dropped 4% since July 6, mainly attributed to a soft US Dollar and lowes US bond yields.
On the Japanese front, households’ expectations for higher inflation levels put pressure on the Bank of Japan (BoJ). According to Reuters, “Households expect inflation to average 10.5% a year from now, the June survey showed, down from 11.1% in the previous survey but well above the BOJ’s 2% target.” That comes at the expense of BoJ Governor Kazuo Ueda’s stance to keep monetary policy loose until the BoJ sees clear evidence that inflation will persist at around 2%.
USD/JPY Price Analysis: Technical outlook
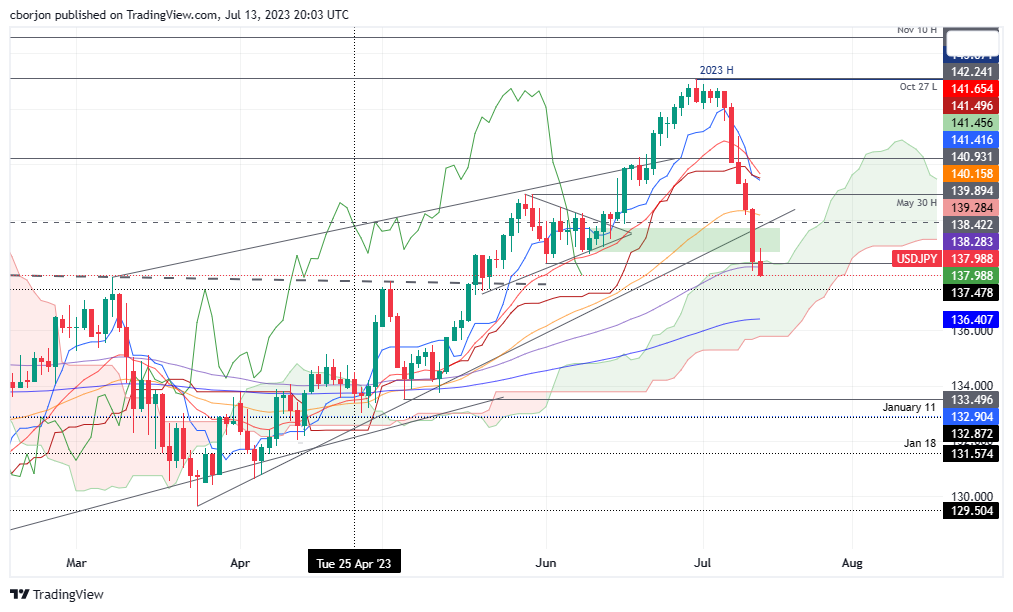
The USD/JPY has tumbled below the 100-day Exponential Moving Average (EMA) of 138.79, extending its downward path past the top of the Ichimoku Cloud. With USD/JPY prices dropping inside the Cloud suggests the trend is still strong. The Tenkan-Sen crossing below the Kijun-Sen, while the Chikou Span standing below the price action, means the USD/JPY shifted bearish and could threaten to edge lower. First support emerges at the 137.00 mark, followed by the 200-day EMA at 136.40. Conversely, if USD/JPY buyers reclaim 138.00, that could pave the way to regain the 100-day EMA, followed by the 139.00 figure.
Author

Christian Borjon Valencia
FXStreet
Markets analyst, news editor, and trading instructor with over 14 years of experience across FX, commodities, US equity indices, and global macro markets.


