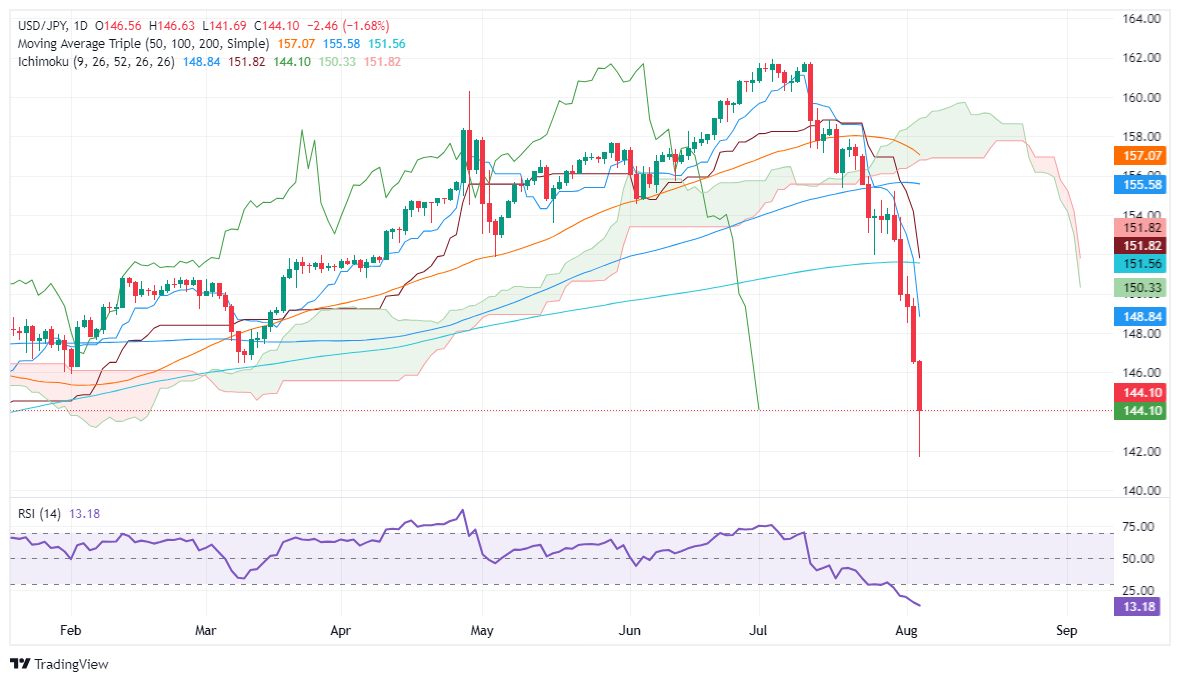
- USD/JPY drops over 4.90% to a low of 141.69 during Asian session before rebounding to 144.16.
- Technical outlook: Downward bias with potential for mean-reversion move as RSI indicates overextension.
- Key resistance levels: 145.00, February 1 bottom at 145.89, and March 11 level at 146.48.
- Key support levels: 144.00, January 9 pivot low at 143.42, and August 5 bottom at 141.69.
The Japanese Yen extended its rally on Monday, registering more than 1.63% gains. This witnessed the USD/JPY drop over 4.90% during the Asian session to a low of 141.69 before trimming some losses and regaining the 144.00 mark. At the time of writing, the USD/JPY trades at 144.16, virtually unchanged as Tuesday’s Asian session begins.
USD/JPY Price Forecast: Technical outlook
The USD/JPY is downward biased yet has found a bottom at around 141.69. Once hit, buyers emerged at the bottom and lifted the exchange rate since the mid-North American session. The latest push saw spot prices above 144.00 as momentum shows the downtrend is overextended, as shown by the Relative Strength Index (RSI).
As the RSI lies beneath 20, the pair is subject to a mean-reversion move.
If USD/JPY climbs past 145.00, the next resistance will be on February 1, bottom at 145.89. Once surpassed, the March 11 146.48 emerges, followed by the 147.00 mark.
Conversely, if USD/JPY extends its losses below 144.00, the next support would be the January 9 pivot low at 143.42, ahead of the August 5 bottom at 141.69.
USD/JPY Price Action – Daily Chart
Japanese Yen PRICE Today
The table below shows the percentage change of Japanese Yen (JPY) against listed major currencies today. Japanese Yen was the strongest against the Swiss Franc.
USD | EUR | GBP | JPY | CAD | AUD | NZD | CHF | |
---|---|---|---|---|---|---|---|---|
USD | -0.00% | -0.01% | -0.06% | -0.02% | 0.02% | 0.10% | 0.03% | |
EUR | 0.00% | 0.03% | -0.05% | -0.02% | 0.02% | 0.04% | 0.04% | |
GBP | 0.00% | -0.03% | -0.07% | -0.03% | -0.00% | 0.03% | 0.02% | |
JPY | 0.06% | 0.05% | 0.07% | 0.02% | 0.08% | 0.08% | 0.27% | |
CAD | 0.02% | 0.02% | 0.03% | -0.02% | 0.03% | 0.06% | 0.05% | |
AUD | -0.02% | -0.02% | 0.00% | -0.08% | -0.03% | 0.04% | 0.03% | |
NZD | -0.10% | -0.04% | -0.03% | -0.08% | -0.06% | -0.04% | 0.04% | |
CHF | -0.03% | -0.04% | -0.02% | -0.27% | -0.05% | -0.03% | -0.04% |
The heat map shows percentage changes of major currencies against each other. The base currency is picked from the left column, while the quote currency is picked from the top row. For example, if you pick the Japanese Yen from the left column and move along the horizontal line to the US Dollar, the percentage change displayed in the box will represent JPY (base)/USD (quote).
Information on these pages contains forward-looking statements that involve risks and uncertainties. Markets and instruments profiled on this page are for informational purposes only and should not in any way come across as a recommendation to buy or sell in these assets. You should do your own thorough research before making any investment decisions. FXStreet does not in any way guarantee that this information is free from mistakes, errors, or material misstatements. It also does not guarantee that this information is of a timely nature. Investing in Open Markets involves a great deal of risk, including the loss of all or a portion of your investment, as well as emotional distress. All risks, losses and costs associated with investing, including total loss of principal, are your responsibility. The views and opinions expressed in this article are those of the authors and do not necessarily reflect the official policy or position of FXStreet nor its advertisers. The author will not be held responsible for information that is found at the end of links posted on this page.
If not otherwise explicitly mentioned in the body of the article, at the time of writing, the author has no position in any stock mentioned in this article and no business relationship with any company mentioned. The author has not received compensation for writing this article, other than from FXStreet.
FXStreet and the author do not provide personalized recommendations. The author makes no representations as to the accuracy, completeness, or suitability of this information. FXStreet and the author will not be liable for any errors, omissions or any losses, injuries or damages arising from this information and its display or use. Errors and omissions excepted.
The author and FXStreet are not registered investment advisors and nothing in this article is intended to be investment advice.
Recommended content
Editors’ Picks

EUR/USD bounces off lows, approaches 1.1550
EUR/USD continues to recover ground lost and now extends the rebound to the 1.1550 zone on Friday. Meanwhile, the US Dollar maintain its bullish bias intact in response to a significant flight to safety amid increasing geopolitical concerns, while positive consumer sentiment data also contribute to the daily uptick.

Gold keeps the trade above $3,400 on safe-haven demand
Gold prices maintain its upward trajectory on Friday, reaching its peak level since late April above the $3,400 mark per troy ounce. Furthermore, the precious metal draws increased safe-haven interest amid escalating tensions in the Middle East, triggered by Israel's military action against Iran.

GBP/USD trims losses, retargets 1.3600
After an earlier dip toward the 1.3520 area, GBP/USD has regained some composure, trading within sight of the key 1.3600 barrier as the week draws to a close. The pair remains under pressure on Friday, weighed down by renewed US Dollar strength amid rising risk aversion and a stronger-than-expected consumer confidence report.

Crypto Today: Bitcoin, Ethereum, XRP clamber for support amid escalating volatility on Israel-Iran tensions
The cryptocurrency market has been hit by a sudden wave of extreme volatility, triggering widespread declines as global markets react to tensions between Israel and Iran. Bitcoin is hovering at around $104,668 at the time of writing on Friday, following a reflex recovery from support tested at $102,513.

Week ahead – Markets brace for central bank barrage amid heightened uncertainty
Fed officials to stand pat as they await further clarity. A dovish BoJ could push rate hike expectations into 2026. Deflation fuels speculation about negative SNB rates. BoE may sound more dovish after disappointing UK data.