USD/JPY Price Analysis: Triple-bottom target reached, as it meanders around 117.00


  • The USD/JPY is set to end the week with gains close to 2%.
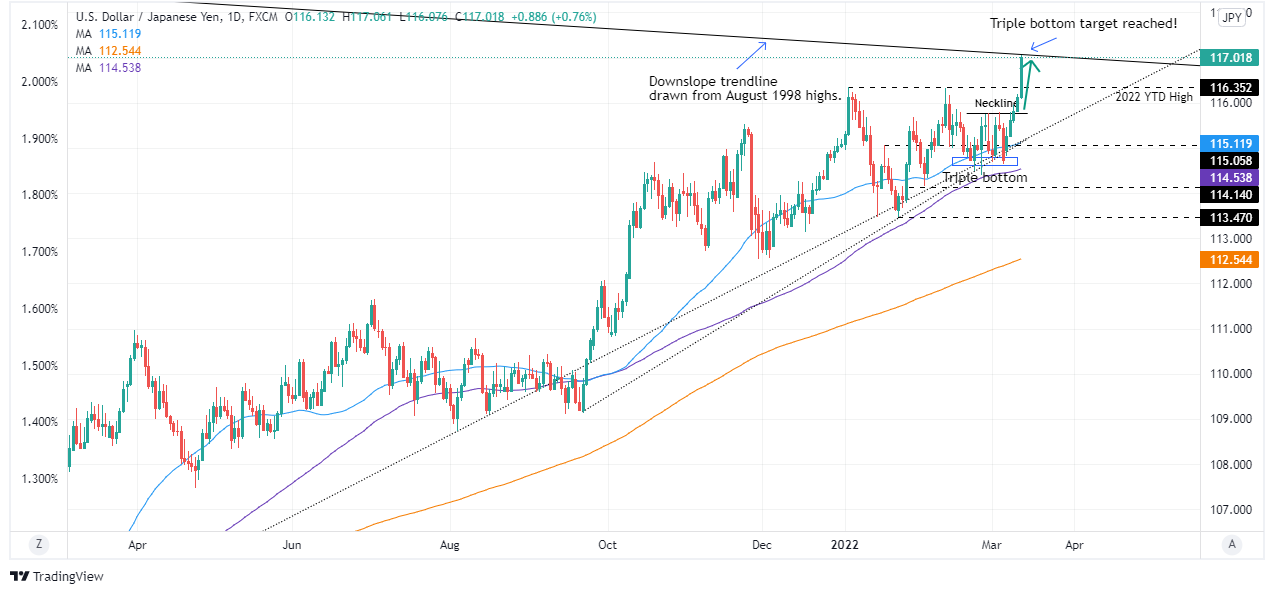
  • The triple bottom chart pattern was fulfilled once the USD/JPY reached a YTD high above 117.00.
  • USD/JPY Technical Outlook: Upward biased, but downside risks remain as a 24-year-old downslope trendline near 117.00 looms.

The USD/JPY is ready to finish the week on a higher note, on a risk-on market mood, underpinned by higher US Treasury yields, led by the 10-year T-note sitting at 2.01%. At the time of writing, the USD/JPY is trading at 117.00.

Risk appetite increased during the European session when Russian President Putin expressed that has been a “certain positive shift” in talks with Ukraine while keeping hopes of a possible meeting with his counterpart, the Ukrainian President Zelensky, alive.

Aside from this, the greenback remains firm during the North American session. The US Dollar Index, a gauge of the buck’s performance vs. a basket of six rivals, keeps heading north, up 0.23%, sits at 98.756, a tailwind for the pair.

Overnight, the USD/JPY followed the path of least resistance, continuing the uptrend. It is worth noting that the triple-bottom chart pattern target at 117.00 was fulfilled, as the pair’s daily high, which also is a YTD high was 117.06.

USD/JPY Price Forecast: Technical outlook

The USD/JPY remains upward biased, though traders need to be aware of a trendline that travels from August 1998 highs, a 24-year-old downslope trendline, which could be difficult resistance to overcome by USD/JPY bulls.

That said, the USD/JPY first resistance would be 117.00. Breach of the latter would expose the 118.00 mark, followed by January 17, 2021, high at 118.61, and then the 119.00 mark.

USD/JPY

Overview
Today last price 117
Today Daily Change 0.88
Today Daily Change % 0.76
Today daily open 116.12
 
Trends
Daily SMA20 115.31
Daily SMA50 115.1
Daily SMA100 114.52
Daily SMA200 112.52
 
Levels
Previous Daily High 116.2
Previous Daily Low 115.8
Previous Weekly High 115.81
Previous Weekly Low 114.65
Previous Monthly High 116.34
Previous Monthly Low 114.16
Daily Fibonacci 38.2% 116.05
Daily Fibonacci 61.8% 115.95
Daily Pivot Point S1 115.88
Daily Pivot Point S2 115.64
Daily Pivot Point S3 115.49
Daily Pivot Point R1 116.27
Daily Pivot Point R2 116.43
Daily Pivot Point R3 116.67


Share: Feed news

Information on these pages contains forward-looking statements that involve risks and uncertainties. Markets and instruments profiled on this page are for informational purposes only and should not in any way come across as a recommendation to buy or sell in these assets. You should do your own thorough research before making any investment decisions. FXStreet does not in any way guarantee that this information is free from mistakes, errors, or material misstatements. It also does not guarantee that this information is of a timely nature. Investing in Open Markets involves a great deal of risk, including the loss of all or a portion of your investment, as well as emotional distress. All risks, losses and costs associated with investing, including total loss of principal, are your responsibility. The views and opinions expressed in this article are those of the authors and do not necessarily reflect the official policy or position of FXStreet nor its advertisers. The author will not be held responsible for information that is found at the end of links posted on this page.

If not otherwise explicitly mentioned in the body of the article, at the time of writing, the author has no position in any stock mentioned in this article and no business relationship with any company mentioned. The author has not received compensation for writing this article, other than from FXStreet.

FXStreet and the author do not provide personalized recommendations. The author makes no representations as to the accuracy, completeness, or suitability of this information. FXStreet and the author will not be liable for any errors, omissions or any losses, injuries or damages arising from this information and its display or use. Errors and omissions excepted.

The author and FXStreet are not registered investment advisors and nothing in this article is intended to be investment advice.

Recommended content


Recommended content

Editors’ Picks

EUR/USD trims gains, back below 1.1300

EUR/USD trims gains, back below 1.1300

EUR/USD gained bullish traction on Monday, climbing above the 1.1300 mark as the US Dollar came under sustained selling pressure. The move followed Moody’s downgrade of the US sovereign credit rating, which added to the pair’s upside momentum.

GBP/USD sticks to daily gains around 1.3360

GBP/USD sticks to daily gains around 1.3360

GBP/USD extended its rally on Monday, briefly surpassing the 1.3400 mark on the back of renewed weakness in the Greenback, which was particulalry exacerbated following Moody’s decision to downgrade the US credit rating by one notch.

Gold meets daily resistance around $3,250

Gold meets daily resistance around $3,250

Gold regained momentum on Monday, climbing toward the $3,250 mark per troy ounce in response to a cautious market tone. In fact, investors sought safe-haven assets in response to Moody’s downgrade of the US government’s credit rating and renewed trade concerns.

Stock futures contract after Moody's US debt downgrade

Stock futures contract after Moody's US debt downgrade Premium

US stocks opened on a sour note on Monday following the fallout late Friday when the Moody's credit rating agency lowered its outlook on US debt from Aaa to Aa1. Moody's had already had the US government on watch for a year and half, so the actual downgrade shouldn't have surprised investors too much.

China April slowdown shows the impact of economic uncertainty

China April slowdown shows the impact of economic uncertainty

Trade war uncertainty is denting Chinese confidence, resulting in slower economic activity in April. Retail sales and fixed-asset investment both underperformed forecasts amid heightened caution. Yet the impact on manufacturing was less than feared.

The Best brokers to trade EUR/USD

The Best brokers to trade EUR/USD

SPONSORED Discover the top brokers for trading EUR/USD in 2025. Our list features brokers with competitive spreads, fast execution, and powerful platforms. Whether you're a beginner or an expert, find the right partner to navigate the dynamic Forex market.

Forex MAJORS

Cryptocurrencies

Signatures

Best Brokers of 2025