|

USD/JPY Price Analysis: Tanks from five-week highs as a bearish-engulfing candle emerges

  • USD/JPY sinks 100 pips and is losing more than 0.70% due to mixed US economic data.
  • A bearish-engulfing candle pattern in the daily chart could pave the way for further losses.
  • The USD/JPY is trading below the 100-hour EMA, with sellers keeping the fort afloat.

The USD/JPY plunges from weekly highs around 137.70 as US recession fears were fueled by mixed US economic data, dropping into contractionary territory, namely S&P Global Services and Composite PMIs, while the Manufacturing expanded. Nevertheless, traders took advantage of an overpriced US dollar and sent the major down. At the time of writing, the USD/JPY is trading at 136.39, below its opening price by 0.80%.

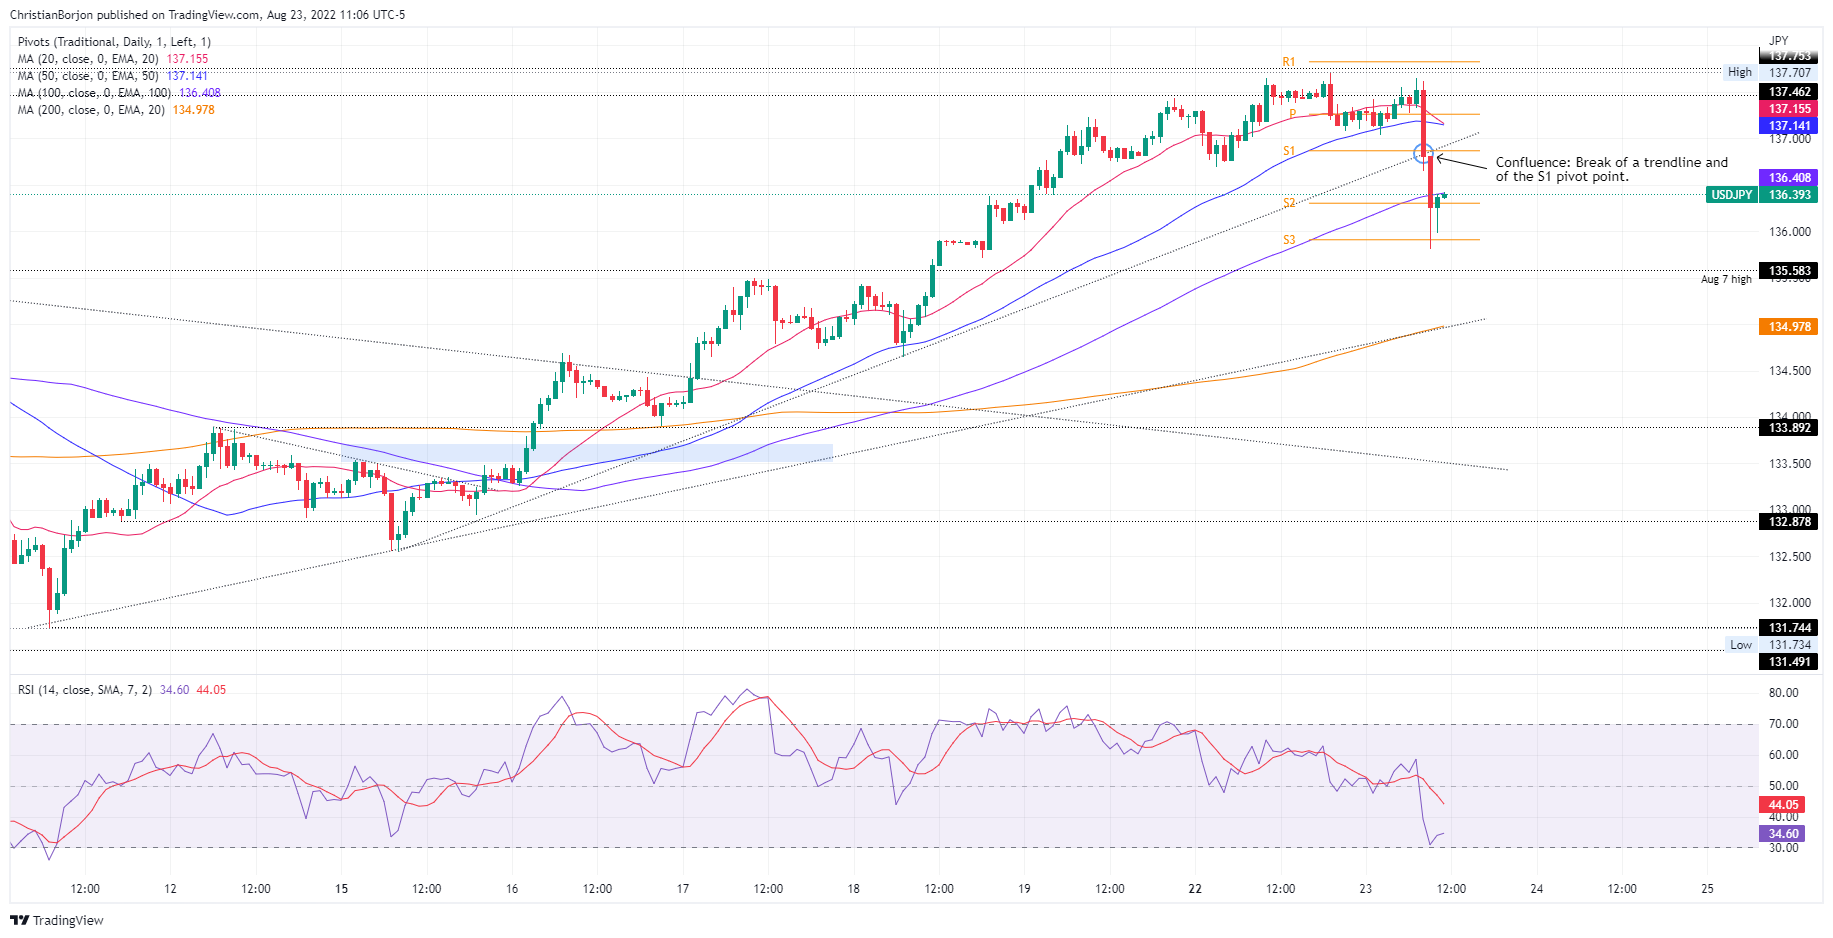
USD/JPY Price Analysis: Technical outlook

The daily chart shows that a bearish-engulfing candle pattern is emerging, which could pave the way for further losses. However, it’s worth noting that the pair tested the August 19 daily low at 135.71, but sellers could not hold buyers from reclaiming the 136.00 figure. Even though a bearish-engulfing candle pattern is bearish, sellers will face solid support at 135.71, followed by the 50-day EMA at 135.52.

The one-hour scale depicts that the USD/JPY broke below a confluence of the S1 daily pivot and a downslope trendline, exacerbating a fall towards the S3 pivot at 135.91, where USD buyers stepped in. Nevertheless, they’re facing resistance at the 100-hour EMA at 136,39, which, once cleared, could pave the way towards the 137.00 figure. Nonetheless, the most likely scenario is that the USD/JPY head downwards due to a confluence of the indicators tilting the pair as bearish,

Therefore, the USD/JPY first support will be the S3 pivot at 135-90. Break below will expose the August 7 high at 135.58, followed by the 200-hour EMA at 134.98.

USD/JPY Key Technical Levels

USD/JPY

Overview
Today last price136.39
Today Daily Change-1.10
Today Daily Change %-0.80
Today daily open137.47
 
Trends
Daily SMA20134.5
Daily SMA50135.54
Daily SMA100132.12
Daily SMA200123.91
 
Levels
Previous Daily High137.65
Previous Daily Low136.7
Previous Weekly High137.23
Previous Weekly Low132.56
Previous Monthly High139.39
Previous Monthly Low132.5
Daily Fibonacci 38.2%137.29
Daily Fibonacci 61.8%137.06
Daily Pivot Point S1136.9
Daily Pivot Point S2136.33
Daily Pivot Point S3135.95
Daily Pivot Point R1137.85
Daily Pivot Point R2138.22
Daily Pivot Point R3138.79

Author

Christian Borjon Valencia

Markets analyst, news editor, and trading instructor with over 14 years of experience across FX, commodities, US equity indices, and global macro markets.

More from Christian Borjon Valencia
Share:

Editor's Picks

EUR/USD looks apathetic around 1.1770

EUR/USD comes under renewed pressure on Tuesday, deflating below the 1.1800 support and reversing two consecutive days of gains. The pair’s decline follows the persistent move higher in the US Dollar, as trade uncertainty dominates the sentiment ahead of President Trump’s SOTU speech.

GBP/USD regains 1.3500 and above

GBP/USD extends its advance for the third day in a row on Tuesday, this time retesting the area beyond the 1.3500 hurdle. Cable’s uptick comes despite decent gains in the Greenback and the dovish message from the BoE’s Bailey at the UK Parliament.

Gold appears offered around $5,150

Gold is giving back a good portion of the recent multi-day rally, receding to the $5,150 zone per troy ounce amid the decent bounce in the US Dollar and mixed US Treasuty yields. In the meantime, markets’ attention remain on upcoming comments from Fed speakers.

Crypto Today: Bitcoin, Ethereum, XRP come under renewed pressure amid ETF outflows, tariff uncertainty

Bitcoin, Ethereum and Ripple are trading under increasing selling pressure at the time of writing on Tuesday, as market participants navigate renewed tariff uncertainty. The Crypto King holds above $63,000, down 2% intraday from its $64,656 open.

The Citrini report: How a debatable AI narrative can shake Wall Street

That AI-related headline alone was enough to rattle investors.US stocks slid sharply on Monday after a widely circulated Citrini Research memo outlined a hypothetical “2028 Global Intelligence Crisis”, warning that rapid AI adoption could push US unemployment into double digits as early as by mid-2028.

XRP pressured by weak ETF flows and declining retail interest

Ripple (XRP) is edging lower, trading above its intraday low of $1.32 at the time of writing on Tuesday. The decline from its weekly opening of $1.39 reflects heightened volatility in the broader cryptocurrency market, accentuated by tariff-triggered uncertainty.