USD/JPY Price Analysis: Struggles at 157.00, drops and remains subdued
- USD/JPY is virtually unchanged but below its opening price.
- The momentum begins to shift in favor of sellers, yet they must reclaim key support levels.
- If buyers reclaim 157.00 and 157.71, that could pave the way to test YTD high levels.

The USD/JPY retreats during the North American session yet is virtually unchanged as traders brace for Wednesday’s busy economic docket, which will feature May's US Consumer Price Index (CPI) data and the Federal Open Market Committee (FOMC) monetary policy decision. The pair trades at 156.94, down some 0.06%.
USD/JPY Price Analysis: Technical outlook
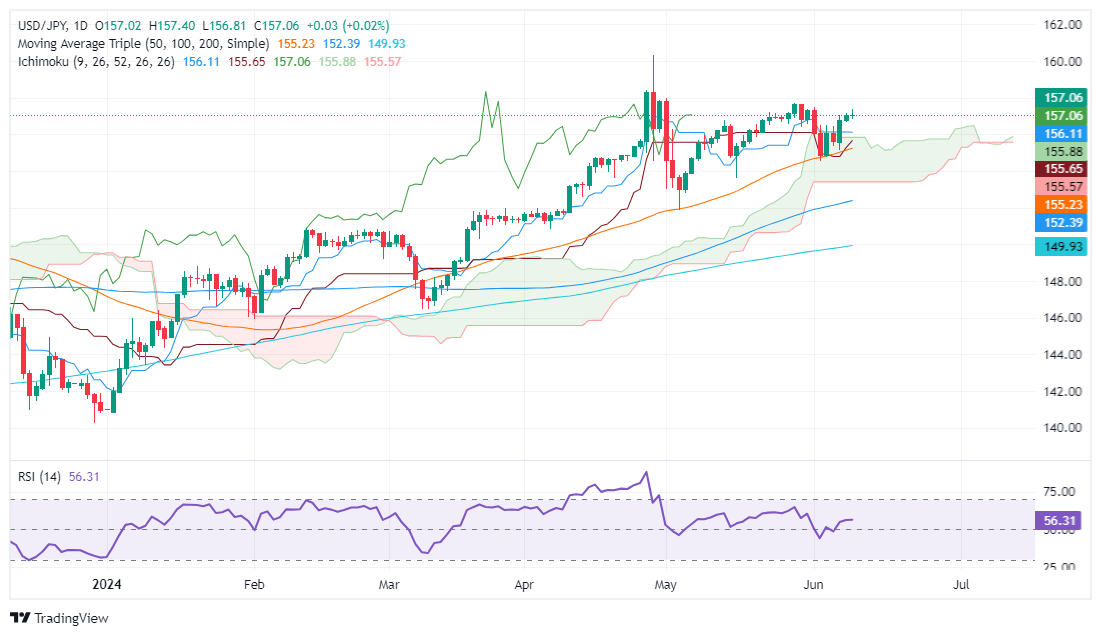
The USD/JPY daily chart suggests that buyers are losing steam; after hitting a weekly high of 157.40, they failed to hold gains above 157.00. Momentum is also fading, as the Relative Strength Index (RSI) remains bullish, but it’s aiming downwards.
If the USD/JPY extends its fall below the current weekly low of 156.64, the next stop would be the Senkou Span A at 155.88. Further losses are seen at Senkou Span B at 155.65, followed by the 50-day moving average (DMA) at 155.22.
Conversely, if USD/JPY buyers lift the exchange rate past the 157.00 figure, the next resistance would be the May 29 high of 157.71. Once cleared, the next stop would be the April 26 high at 158.44 before challenging the year-to-date (YTD) high of 158.44.
USD/JPY Price Action – Daily Chart
Japanese Yen PRICE Today
The table below shows the percentage change of Japanese Yen (JPY) against listed major currencies today. Japanese Yen was the strongest against the Euro.
| USD | EUR | GBP | JPY | CAD | AUD | NZD | CHF | |
|---|---|---|---|---|---|---|---|---|
| USD | 0.19% | -0.12% | 0.00% | -0.05% | 0.01% | -0.30% | 0.11% | |
| EUR | -0.19% | -0.31% | -0.19% | -0.23% | -0.16% | -0.48% | -0.08% | |
| GBP | 0.12% | 0.31% | 0.12% | 0.07% | 0.13% | -0.18% | 0.19% | |
| JPY | 0.00% | 0.19% | -0.12% | -0.03% | 0.00% | -0.30% | 0.08% | |
| CAD | 0.05% | 0.23% | -0.07% | 0.03% | 0.06% | -0.26% | 0.12% | |
| AUD | -0.01% | 0.16% | -0.13% | -0.01% | -0.06% | -0.32% | 0.05% | |
| NZD | 0.30% | 0.48% | 0.18% | 0.30% | 0.26% | 0.32% | 0.38% | |
| CHF | -0.11% | 0.08% | -0.19% | -0.08% | -0.12% | -0.05% | -0.38% |
The heat map shows percentage changes of major currencies against each other. The base currency is picked from the left column, while the quote currency is picked from the top row. For example, if you pick the Japanese Yen from the left column and move along the horizontal line to the US Dollar, the percentage change displayed in the box will represent JPY (base)/USD (quote).
Author

Christian Borjon Valencia
FXStreet
Markets analyst, news editor, and trading instructor with over 14 years of experience across FX, commodities, US equity indices, and global macro markets.


