|

USD/JPY Price Analysis: Steady around 113.75, trapped within the 113.50-114.20 range

  • USD/JPY slumps during the day, despite broad US dollar strength across the board.
  • Lower US T-bond yields weighed on the USD/JPY pair, benefiting the Japanese yen.
  • USD/JPY: Bullish above 114.00, otherwise range-bound, with 113.50 as strong support.

The USD/JPY slides during the New York session, down 0.21%, trading at 113.76 at the time of writing. As portrayed by US stock indices rising between 0.01% and 1.30%, market sentiment is upbeat, except for the Dow Jones Industrial losing 0.35%. In the FX market, risk-averse sentiment prevails, as safe-haven peers appreciate, thus favoring the Japanese yen, versus the greenback.

In the meantime, the US Dollar Index, a basket of six currencies, rises almost half percent, up to 94.32. Contrarily, the US 10-year Treasury yield drops six basis points, sits at 1.519%, a tailwind for the USD/JPY, due to its high correlation.

USD/JPY Price Forecast: Technical analysis

4-hour chart

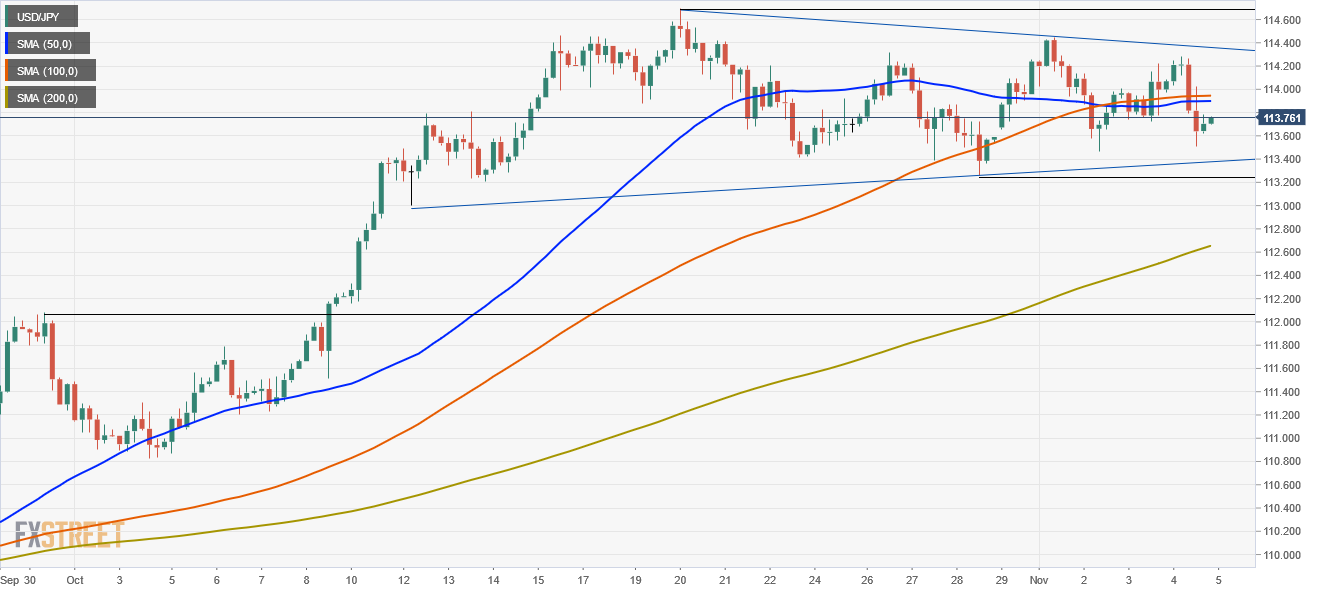
The USD/JPY is in consolidation within the 113.50-114.50 range. Furthermore, the 50 and the 100-simple moving averages (SMA’s) hover around 114.00, acting as a tailwind for price action in the last couple of days. It’s worth noticing that the 113.50 is a level respected by USD/JPY traders, in which the pair bounced off towards the top of the range. Nevertheless, the almost horizontal slope of the moving averages does not provide enough clues for the direction of the trend.

For USD bulls to resume the upward trend, they need to reclaim the 114.00 figure. In that ourcome, the following resistance on the way north would be the downslope trendline that travels from October 20 high towards November 1 high, around 114.30. A breach of the latter would expose the 2021 high at 114.70.

On the flip side, a break below 113.50 could open the way for further losses. The first demand zone would be 113.00, followed by the September 30 high at 112.00.

USD/JPY TECHNICAL SUPPORT/RESISTANCE LEVELS

Overview
Today last price113.7
Today Daily Change-0.30
Today Daily Change %-0.26
Today daily open114
 
Trends
Daily SMA20113.68
Daily SMA50111.64
Daily SMA100110.9
Daily SMA200109.57
 
Levels
Previous Daily High114.22
Previous Daily Low113.72
Previous Weekly High114.31
Previous Weekly Low113.26
Previous Monthly High114.7
Previous Monthly Low110.82
Daily Fibonacci 38.2%114.03
Daily Fibonacci 61.8%113.91
Daily Pivot Point S1113.74
Daily Pivot Point S2113.48
Daily Pivot Point S3113.25
Daily Pivot Point R1114.24
Daily Pivot Point R2114.48
Daily Pivot Point R3114.74

Author

Christian Borjon Valencia

Christian Borjon began his career as a retail trader in 2010, mainly focused on technical analysis and strategies around it. He started as a swing trader, as he used to work in another industry unrelated to the financial markets.

More from Christian Borjon Valencia
Share:

Markets move fast. We move first.

Orange Juice Newsletter brings you expert driven insights - not headlines. Every day on your inbox.

By subscribing you agree to our Terms and conditions.

Editor's Picks

EUR/USD clings to small gains near 1.1750

Following a short-lasting correction in the early European session, EUR/USD regains its traction and clings to moderate gains at around 1.1750 on Monday. Nevertheless, the pair's volatility remains low, with investors awaiting this weeks key data releases from the US and the ECB policy announcements.

GBP/USD edges higher toward 1.3400 ahead of US data and BoE

GBP/USD reverses its direction and advances toward 1.3400 following a drop to the 1.3350 area earlier in the day. The US Dollar struggles to gather recovery momentum as markets await Tuesday's Nonfarm Payrolls data, while the Pound Sterling holds steady ahead of the BoE policy announcements later in the week.

Gold stuck around $4,300 as markets turn cautious

Gold loses its bullish momentum and retreats below $4,350 after testing this level earlier on Monday. XAU/USD, however, stays in positive territory as the US Dollar remains on the back foot on growing expectations for a dovish Fed policy outlook next year.

Solana consolidates as spot ETF inflows near $1 billion signal institutional dip-buying

Solana price hovers above $131 at the time of writing on Monday, nearing the upper boundary of a falling wedge pattern, awaiting a decisive breakout. On the institutional side, demand for spot Solana Exchange-Traded Funds remained firm, pushing total assets under management to nearly $1 billion since launch. 

Big week ends with big doubts

The S&P 500 continued to push higher yesterday as the US 2-year yield wavered around the 3.50% mark following a Federal Reserve (Fed) rate cut earlier this week that was ultimately perceived as not that hawkish after all. The cut is especially boosting the non-tech pockets of the market.

Solana Price Forecast: SOL consolidates as spot ETF inflows near $1 billion signal institutional dip-buying

Solana (SOL) price hovers above $131 at the time of writing on Monday, nearing the upper boundary of a falling wedge pattern, awaiting a decisive breakout.