• USD/JPY extended its rally for the seventh consecutive week, gaining some 2.19%.
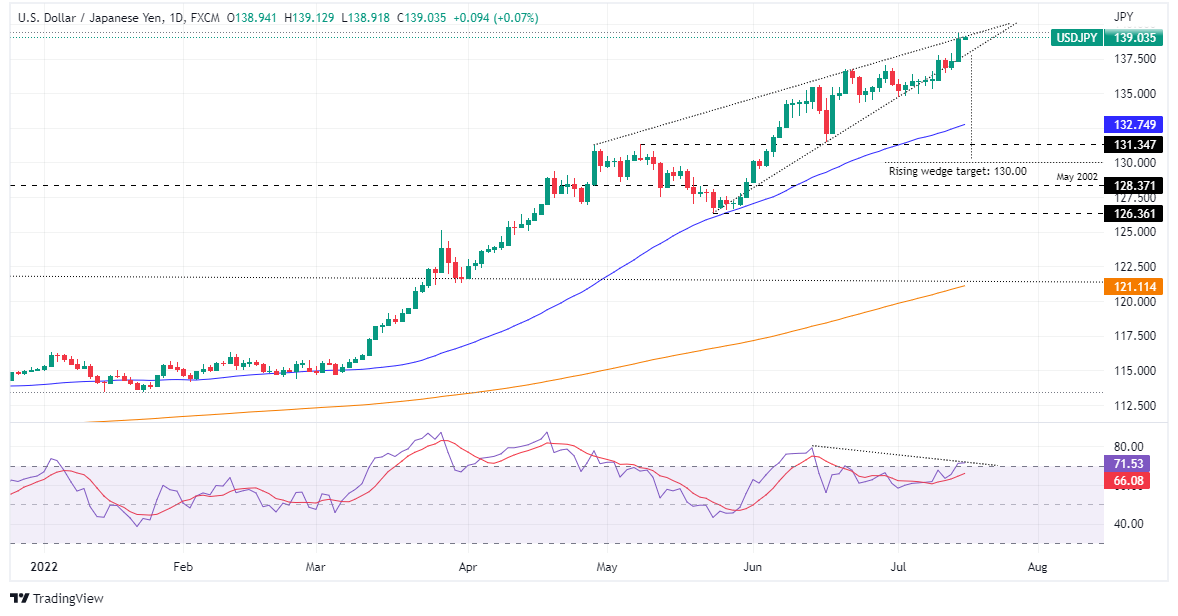
  • The USD/JPY negative divergence in the daily chart might pave the way for a pullback.
  • A rising wedge remains in play and, once broken, targets the USD/JPY might fall towards 130.00.

The USD/JPY reached a fresh 24-year high around 139.38, though of late dipped near the 139.10s area, as market participants scaled back expectations of a 100 bps rate hike following Wednesday’s hot US CPI reading, which opened the door for speculations of the aforementioned. At the time of writing, the USD/JPY is trading at 139.03, recording a minimal gain of 0.03%.

USD/JPY Thursday’s session began around the 137.50 figure, near the bottom of a rising wedge, and rallied sharply towards a fresh 24-year high at 139.38. However, the major retreated near 138.50 before launching a renewed assault above 139.00, where the price settled near the end of the New York session.

USD/JPY Daily chart

The USD/JPY daily chart remains upward biased, though price action looks overextended due to the parabolic rally, which began around March 2022. Oscillators are again entering overbought conditions, illustrating a negative divergence, which means that price action is printing higher highs, while the Relative Strength Index (RSI) is registering lower peaks, opening the door for a pullback.

Therefore, if the above scenario plays out, the USD/JPY's first support would be July 14 daily low at 137.28. A breach of the latter will send the pair tumbling towards the July 6 low at 134.94, followed by the June 16 cycle low at 131.49.

USD/JPY Key Technical Levels


Overview
Today last price 139.03
Today Daily Change 1.75
Today Daily Change % 1.27
Today daily open 137.29
 
Trends
Daily SMA20 135.77
Daily SMA50 132.43
Daily SMA100 127.41
Daily SMA200 120.86
 
Levels
Previous Daily High 137.87
Previous Daily Low 136.69
Previous Weekly High 136.56
Previous Weekly Low 134.78
Previous Monthly High 137
Previous Monthly Low 128.65
Daily Fibonacci 38.2% 137.42
Daily Fibonacci 61.8% 137.14
Daily Pivot Point S1 136.7
Daily Pivot Point S2 136.11
Daily Pivot Point S3 135.52
Daily Pivot Point R1 137.88
Daily Pivot Point R2 138.46
Daily Pivot Point R3 139.05


Share: Feed news

Information on these pages contains forward-looking statements that involve risks and uncertainties. Markets and instruments profiled on this page are for informational purposes only and should not in any way come across as a recommendation to buy or sell in these assets. You should do your own thorough research before making any investment decisions. FXStreet does not in any way guarantee that this information is free from mistakes, errors, or material misstatements. It also does not guarantee that this information is of a timely nature. Investing in Open Markets involves a great deal of risk, including the loss of all or a portion of your investment, as well as emotional distress. All risks, losses and costs associated with investing, including total loss of principal, are your responsibility. The views and opinions expressed in this article are those of the authors and do not necessarily reflect the official policy or position of FXStreet nor its advertisers. The author will not be held responsible for information that is found at the end of links posted on this page.

If not otherwise explicitly mentioned in the body of the article, at the time of writing, the author has no position in any stock mentioned in this article and no business relationship with any company mentioned. The author has not received compensation for writing this article, other than from FXStreet.

FXStreet and the author do not provide personalized recommendations. The author makes no representations as to the accuracy, completeness, or suitability of this information. FXStreet and the author will not be liable for any errors, omissions or any losses, injuries or damages arising from this information and its display or use. Errors and omissions excepted.

The author and FXStreet are not registered investment advisors and nothing in this article is intended to be investment advice.

Recommended content


Recommended content

Editors’ Picks

EUR/USD holds above 1.0700 ahead of key US data

EUR/USD holds above 1.0700 ahead of key US data

EUR/USD trades in a tight range above 1.0700 in the early European session on Friday. The US Dollar struggles to gather strength ahead of key PCE Price Index data, the Fed's preferred gauge of inflation, and helps the pair hold its ground. 

EUR/USD News

USD/JPY stays above 156.00 after BoJ Governor Ueda's comments

USD/JPY stays above 156.00 after BoJ Governor Ueda's comments

USD/JPY holds above 156.00 after surging above this level with the initial reaction to the Bank of Japan's decision to leave the policy settings unchanged. BoJ Governor said weak Yen was not impacting prices but added that they will watch FX developments closely.

USD/JPY News

Gold price oscillates in a range as the focus remains glued to the US PCE Price Index

Gold price oscillates in a range as the focus remains glued to the US PCE Price Index

Gold price struggles to attract any meaningful buyers amid the emergence of fresh USD buying. Bets that the Fed will keep rates higher for longer amid sticky inflation help revive the USD demand.

Gold News

Sei Price Prediction: SEI is in the zone of interest after a 10% leap

Sei Price Prediction: SEI is in the zone of interest after a 10% leap

Sei price has been in recovery mode for almost ten days now, following a fall of almost 65% beginning in mid-March. While the SEI bulls continue to show strength, the uptrend could prove premature as massive bearish sentiment hovers above the altcoin’s price.

Read more

US core PCE inflation set to signal firm price pressures as markets delay Federal Reserve rate cut bets

US core PCE inflation set to signal firm price pressures as markets delay Federal Reserve rate cut bets

The core PCE Price Index, which excludes volatile food and energy prices, is seen as the more influential measure of inflation in terms of Fed positioning. The index is forecast to rise 0.3% on a monthly basis in March, matching February’s increase. 

Read more

Forex MAJORS

Cryptocurrencies

Signatures