|

USD/JPY Price Analysis: Refreshes weekly highs around 115.40 amid Ukraine/Russia war

  • The USD/JPY is climbing in the week 0.38%, as demand for safe-haven currencies rises.
  • USD/JPY plunged on Putin’s “special military operation” headline, but it is paring earlier losses.
  • USD/JPY Technical Outlook: Upward biased in the daily and the 1-hour chart, but higher volatility levels, suggest following the markets in the short-term, caution is warranted.

USD/JPY rises sharply from daily lows around 114.40 to highs 115.30s amid the Russian invasion of Ukraine, which started on Thursday during the Asian Pacific session. That said, investors’ mood dampened as flows through safe-haven peers increased. At the time of writing, the USD/JPY is trading at 115.39.

During the Asian session, the UN hosted an emergency security council meeting. Around that time, Russian President Putin unveiled a speech announcing a “special military operation” in Ukraine, aiming to de-nazify and de-militarize the country.

How is Russian-Ukraine war impacting financial markets? Follow our live coverage updates!

Market’s reaction

The USD/JPY initial reaction to newswires was downwards, with the pair plummeting 70 pips and breaking the 50-day moving average (DMA) at 114.87 on its way down and reached a daily low at 114.40. Once European traders got to their offices, the pair recovered its losses and some more, trading near February 23 daily highs at 115.20.

USD/JPY Price Forecast: Technical outlook

The USD/JPY Is upward biased, as shown by the daily chart from a technical perspective. The daily moving averages (DMAs) reside below the spot price, though it faces resistance around 115.52, November 24, 2021, daily high.

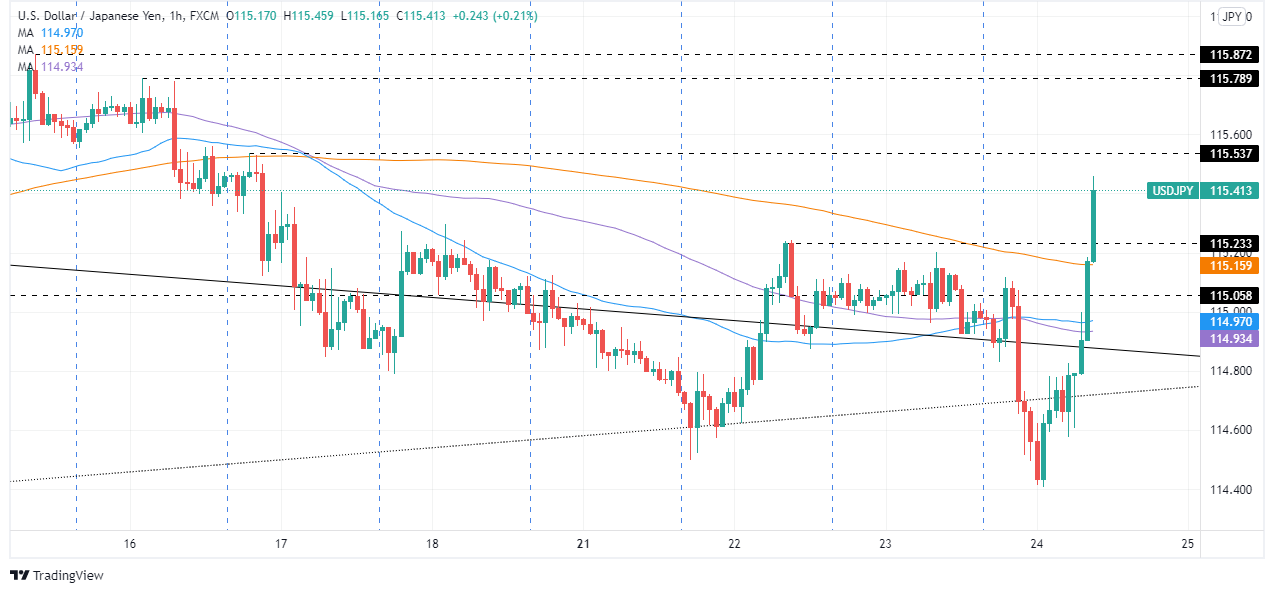
Due to geopolitical developments, it is suggested to take a short-term approach amid high volatility levels witnessed in the financial markets. That said, the USD/JPY 1-hour chart has a bullish bias, and USD/JPY would lean towards February 22 daily high at 115.24 as support. If the pair achieves to print a daily close above it, a move towards the 116.00 figure and YTD high at the 116.30 area is on the cards.

Upwards, the pair's first resistance would be February 17 daily high at 115.53, followed by February 16 cycle high at 115.79 and the February 15 115.82. On the flip side, the USD/JPY first support would be February 22 daily resistance turned support at 115.23. Breach of the latter would expose the 200-hour simple moving average (SMA) at 115.18, followed by the confluence of the 50-100 hour SMAs at 114.97 and 114.93, respectively.

USD/JPY

Overview
Today last price115.4
Today Daily Change0.40
Today Daily Change %0.35
Today daily open115
 
Trends
Daily SMA20115.2
Daily SMA50114.86
Daily SMA100114.31
Daily SMA200112.19
 
Levels
Previous Daily High115.2
Previous Daily Low114.93
Previous Weekly High115.88
Previous Weekly Low114.79
Previous Monthly High116.35
Previous Monthly Low113.47
Daily Fibonacci 38.2%115.03
Daily Fibonacci 61.8%115.1
Daily Pivot Point S1114.89
Daily Pivot Point S2114.77
Daily Pivot Point S3114.61
Daily Pivot Point R1115.16
Daily Pivot Point R2115.32
Daily Pivot Point R3115.43

Author

Christian Borjon Valencia

Christian Borjon began his career as a retail trader in 2010, mainly focused on technical analysis and strategies around it. He started as a swing trader, as he used to work in another industry unrelated to the financial markets.

More from Christian Borjon Valencia
Share:

Markets move fast. We move first.

Orange Juice Newsletter brings you expert driven insights - not headlines. Every day on your inbox.

By subscribing you agree to our Terms and conditions.

Editor's Picks

EUR/USD struggles for direction amid USD gains

EUR/USD is trimming part of its earlier gains, coming under some mild downside pressure near 1.1730 as the US Dollar edges higher. Markets are still digesting the Fed’s latest rate decision, while also looking ahead to more commentary from Fed officials in the sessions ahead.

GBP/USD drops to daily lows near 1.3360

Disappointing UK data weighed on the Sterling towards the end of the week, triggering a pullback in GBP/USD to fresh daily lows near 1.3360. Looking ahead, the next key event across the Channel is the BoE meeting on December 18.

Gold losses momentum, challenges $4,300

Gold now gives away some gains and disputes the key $4,300 zone per troy ounce following earlier multi-week highs. The move is being driven by expectations that the Fed will deliver further rate cuts next year, with the yellow metal climbing despite a firmer Greenback and rising US Treasury yields across the board.

Litecoin Price Forecast: LTC struggles to extend gains, bullish bets at risk

Litecoin (LTC) price steadies above $80 at press time on Friday, following a reversal from the $87 resistance level on Wednesday. Derivatives data suggests a bullish positional buildup while the LTC futures Open Interest declines, flashing a long squeeze risk.

Big week ends with big doubts

The S&P 500 continued to push higher yesterday as the US 2-year yield wavered around the 3.50% mark following a Federal Reserve (Fed) rate cut earlier this week that was ultimately perceived as not that hawkish after all. The cut is especially boosting the non-tech pockets of the market.

Aave Price Forecast: AAVE primed for breakout as bullish signals strengthen

Aave (AAVE) price is trading above $204 at the time of writing on Friday and approaching the upper boundary of its descending parallel channel; a breakout from this structure would favor the bulls.