|

USD/JPY Price Analysis: Range play intact within a potential symmetrical triangle

  • USD/JPY benefits from broad dollar strength.
  • Range trade holds amid mixed cues on the technical set up.
  • 100-bar SMA is the level to beat for the bulls.

USD/JPY is trying hard to break higher from the downside consolidation phase following a dip 107.20 levels in the US last session.

After a volatile session, the bulls are fighting back control in early Asia, mainly benefiting from broad-based US dollar strength, as impressive US Retail Sales data and worrisome coronavirus stats from the US continue to underpin the haven demand for the buck.  

However, the negative tone in the S&P 500 futures could emerge a drag on the pair, going forward. The technical set up on the 15-minutes chart also paints a mixed picture for the spot in the immediate term.

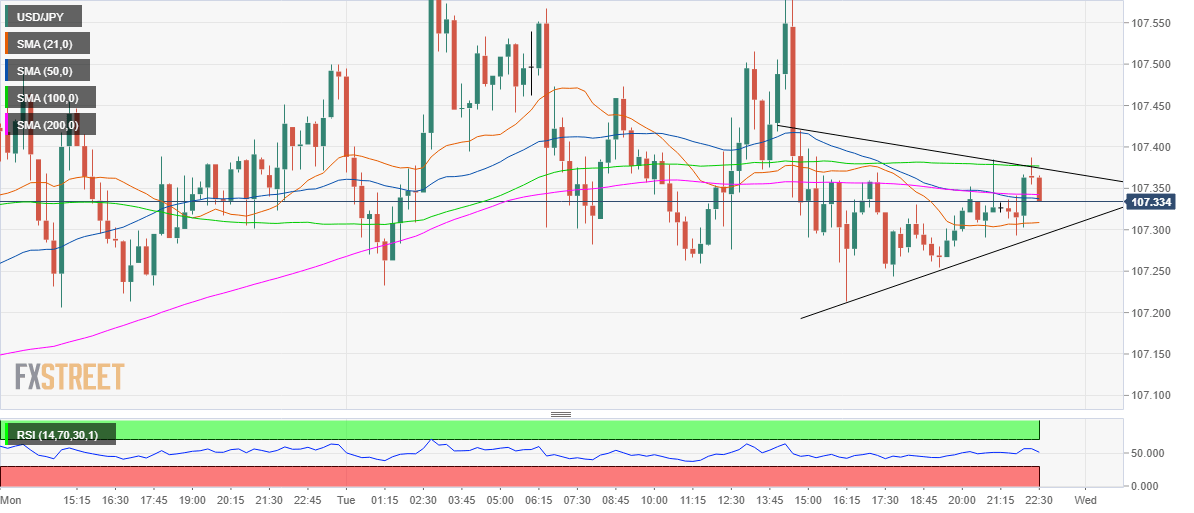
The spot extends range play while traversing withing a potential symmetrical triangle pattern on the said timeframe and on a pattern confirmation could likely test the pattern target of 107.58.

The 107.37/38 resistance zone, however, remains a tough nut to crack for the USD/JPY buyers, where the falling trendline resistance and horizontal 100-bar Simple Moving Average (SMA) coincide.

The immediate downside is capped by the confluence of the 200 and 50-bar SMAs around 107.34. A break below which would expose the horizontal 21-bar SMA at 107.31.

A sustained breach of the rising trendline support at 107.21 could confirm the triangle breakdown and put the 107 level at risk.

Note that Relative Strength Index (RSI) has turned south and looks to test the midline at 50, indicating some near-term weakness.

All in all, a range bounce price action is expected, heading into the Tokyo open, with the sentiment on the Asian equities, USD dynamics and Japanese trade balance closely watched for a decisive break in either direction over the coming hours.

USD/JPY: 15-minutes chart

USD/JPY additional levels

USD/JPY

Overview
Today last price107.35
Today Daily Change0.02
Today Daily Change %0.02
Today daily open107.34
 
Trends
Daily SMA20107.89
Daily SMA50107.58
Daily SMA100108.18
Daily SMA200108.45
 
Levels
Previous Daily High107.57
Previous Daily Low107
Previous Weekly High109.69
Previous Weekly Low106.57
Previous Monthly High108.09
Previous Monthly Low105.99
Daily Fibonacci 38.2%107.22
Daily Fibonacci 61.8%107.35
Daily Pivot Point S1107.03
Daily Pivot Point S2106.73
Daily Pivot Point S3106.46
Daily Pivot Point R1107.61
Daily Pivot Point R2107.87
Daily Pivot Point R3108.18

Author

Dhwani Mehta

Dhwani Mehta

FXStreet

Residing in Mumbai (India), Dhwani is a Senior Analyst and Manager of the Asian session at FXStreet. She has over 10 years of experience in analyzing and covering the global financial markets, with specialization in Forex and commodities markets.

More from Dhwani Mehta
Share:

Editor's Picks

EUR/USD treads water around 1.1900

EUR/USD edges a tad lower around the 1.1900 area, coming under mild pressure despite the US Dollar keeps the offered stance on turnaround Tuesday. On the US data front, December Retail Sales fell short of expectations, while the ADP four week average printed at 6.5K.

GBP/USD looks weak near 1.3670

GBP/USD trades on the back foot around the 1.3670 region on Tuesday. Cable’s modest retracement also comes in tandem with the decent decline in the Greenback. Moving forward, the US NFP and CPI data in combination with key UK releases should kee the quid under scrutiny in the next few days.

Gold flirts with daily lows near $5,000

Gold comes under marked selling pressure on Tuesday, giving back part of its recent two day advance and threatening to challenge the key $5,000 mark per troy ounce. The yellow metal’s correction follows a better tone in the risk complex, a lower Greenback and shrinking US Treasuty yields.

AI Crypto Update: BankrCoin, Pippin surge as sector market cap steadies above $12B

The Artificial Intelligence (AI) segment is largely on the back foot with major coins such as Bittensor (TAO) and Internet Computer (ICP) extending losses amid a sticky risk-off sentiment.

Dollar drops and stocks rally: The week of reckoning for US economic data

Following a sizeable move lower in US technology Stocks last week, we have witnessed a meaningful recovery unfold. The USD Index is in a concerning position; the monthly price continues to hold the south channel support.

XRP holds $1.40 amid ETF inflows and stable derivatives market

Ripple trades under pressure, with immediate support at $1.40 holding at the time of writing on Tuesday. A recovery attempt from last week’s sell-off to $1.12 stalled at $1.54 on Friday, leading to limited price action between the current support and the resistance.