|

USD/JPY Price Analysis: Pulls back from 100-day SMA inside rising channel

  • USD/JPY recovers from nearly three-week low amid bearish MACD.
  • 50% Fibonacci retracement, 200-day SMA add to the support.
  • 61.8% of Fibonacci retracement offers short-term resistance.

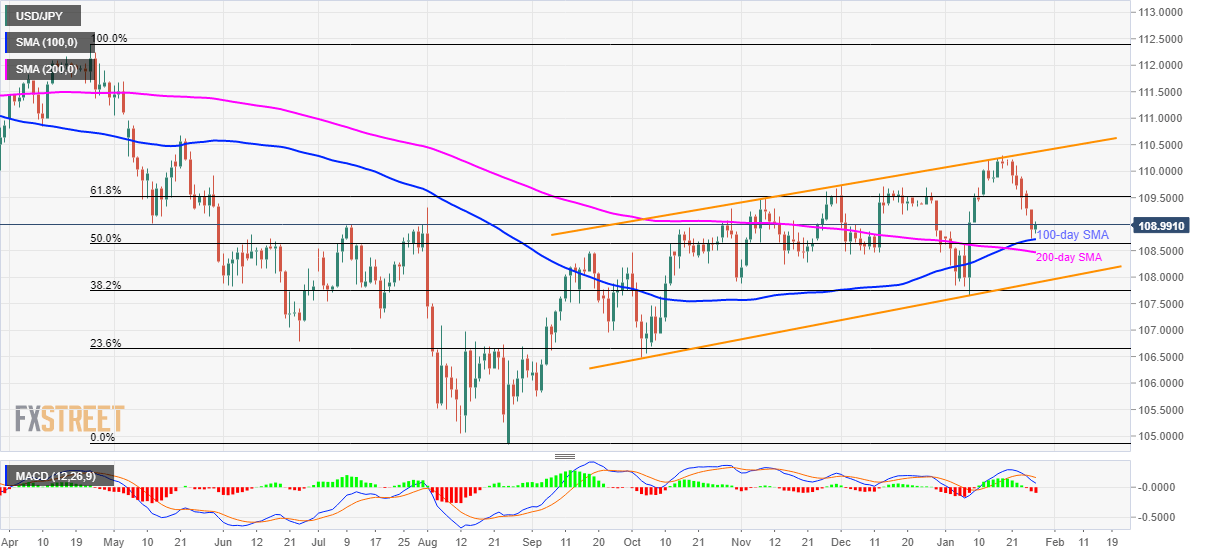
USD/JPY pulls back from 100-day SM awhile taking the bids to 109.03 during early Tuesday. Following its declines below 61.8% Fibonacci retracement of April-August 2019 fall, the pair dropped to the lowest since January 08, amid bearish MACD, in recent days.

While 61.8% Fibonacci retracement, at 109.52, will act as the support-turned-resistance, 109.80 and 110.00 could entertain buyers ahead of making them confront the upper line of the trend channel stretched from early-October 2019, currently near 110.35.

Alternatively, pair’s declines below 100-day SMA level of 108.70 will be limited by 50% Fibonacci retracement and 200-day SMA, 108.60 and 108.45 respectively.

During the quote’s extended weakness under 108.45, the aforementioned channel’s support line near 107.90 will be the key to watch.

USD/JPY daily chart

Trend: Pullback expected

Additional important levels

Overview
Today last price109
Today Daily Change0.11
Today Daily Change %0.10%
Today daily open108.89
 
Trends
Daily SMA20109.33
Daily SMA50109.19
Daily SMA100108.71
Daily SMA200108.49
 
Levels
Previous Daily High109.28
Previous Daily Low108.73
Previous Weekly High110.22
Previous Weekly Low109.17
Previous Monthly High109.8
Previous Monthly Low108.43
Daily Fibonacci 38.2%108.94
Daily Fibonacci 61.8%109.07
Daily Pivot Point S1108.66
Daily Pivot Point S2108.42
Daily Pivot Point S3108.11
Daily Pivot Point R1109.2
Daily Pivot Point R2109.51
Daily Pivot Point R3109.75

Author

Anil Panchal

Anil Panchal

FXStreet

Anil Panchal has nearly 15 years of experience in tracking financial markets. With a keen interest in macroeconomics, Anil aptly tracks global news/updates and stays well-informed about the global financial moves and their implications.

More from Anil Panchal
Share:

Editor's Picks

EUR/USD tests nine-day EMA support near 1.1850

EUR/USD remains in the negative territory for the fourth successive session, trading around 1.1870 during the Asian hours on Friday. The 14-day Relative Strength Index momentum indicator at 56 stays above the midline, confirming steady momentum. RSI has eased but remains above 50, indicating momentum remains constructive for the bulls.

GBP/USD consolidates around 1.3600 vs. USD; looks to US CPI for fresh impetus

The GBP/USD pair remains on the defensive through the Asian session on Friday, though it lacks bearish conviction and holds above the 1.3600 mark as traders await the release of the US consumer inflation figures before placing directional bets.

Gold recovers swiftly from weekly low, climbs back closer to $5,000 ahead of US CPI

Gold regains positive traction during the Asian session on Friday and recovers a part of the previous day's heavy losses to the $4,878-4,877 region, or the weekly low. The commodity has now moved back closer to the $5,000 psychological mark as traders keenly await the release of the US consumer inflation figures for more cues about the Federal Reserve's policy path.

Solana: Mixed market sentiment caps recovery

Solana is trading at $79 as of Friday, following a correction of over 9% so far this week. On-chain and derivatives data indicates mixed sentiment among traders, further limiting the chances of a price recovery.

A tale of two labour markets: Headline strength masks underlying weakness

Undoubtedly, yesterday’s delayed US January jobs report delivered a strong headline – one that surpassed most estimates. However, optimism quickly faded amid sobering benchmark revisions.

Solana Price Forecast: Mixed market sentiment caps recovery

Solana (SOL) is trading at $79 as of Friday, following a correction of over 9% so far this week. On-chain and derivatives data indicates mixed sentiment among traders, further limiting the chances of a price recovery.